Confidence Intervals and Sample Size
Confidence Intervals and Sample Size
Confidence Intervals and Sample Size

Create successful ePaper yourself
Turn your PDF publications into a flip-book with our unique Google optimized e-Paper software.
lu49076_ch07.qxd 5/20/2003 3:16 PM Page 362<br />
362 Chapter 7 <strong>Confidence</strong> <strong>Intervals</strong> <strong>and</strong> <strong>Sample</strong> <strong>Size</strong><br />
measurements was 2.6. Find the 95% confidence interval of<br />
the true variance.<br />
15. A r<strong>and</strong>om sample of 15 snowmobiles was selected, <strong>and</strong><br />
the lifetime (in months) of the batteries was measured. The<br />
variance of the sample was 8.6. Find the 90% confidence<br />
interval of the true variance.<br />
7–38<br />
Statistics Today<br />
Data Analysis<br />
Would You Change the Channel?—Revisited<br />
16. The heights of 28 police officers from a large-city<br />
police force were measured. The st<strong>and</strong>ard deviation of the<br />
sample was 1.83 inches. Find the 95% confidence interval<br />
of the st<strong>and</strong>ard deviation of the heights of the officers.<br />
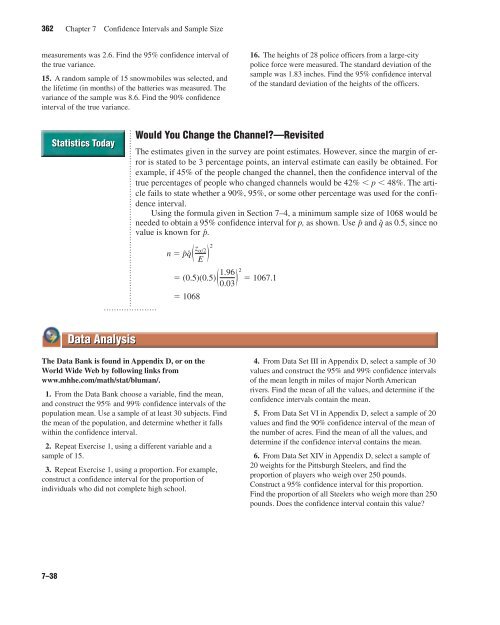
The estimates given in the survey are point estimates. However, since the margin of error<br />
is stated to be 3 percentage points, an interval estimate can easily be obtained. For<br />
example, if 45% of the people changed the channel, then the confidence interval of the<br />
true percentages of people who changed channels would be 42% � p � 48%. The article<br />
fails to state whether a 90%, 95%, or some other percentage was used for the confidence<br />
interval.<br />
Using the formula given in Section 7–4, a minimum sample size of 1068 would be<br />
needed to obtain a 95% confidence interval for p, as shown. Use pˆ <strong>and</strong> qˆ as 0.5, since no<br />
value is known for pˆ .<br />
n � pˆqˆ � z ��2<br />
E � 2<br />
� (0.5)(0.5) � � 1067.1<br />
� 1068<br />
1.96<br />
0.03� 2<br />
The Data Bank is found in Appendix D, or on the<br />
World Wide Web by following links from<br />
www.mhhe.com/math/stat/bluman/.<br />
1. From the Data Bank choose a variable, find the mean,<br />
<strong>and</strong> construct the 95% <strong>and</strong> 99% confidence intervals of the<br />
population mean. Use a sample of at least 30 subjects. Find<br />
the mean of the population, <strong>and</strong> determine whether it falls<br />
within the confidence interval.<br />
2. Repeat Exercise 1, using a different variable <strong>and</strong> a<br />
sample of 15.<br />
3. Repeat Exercise 1, using a proportion. For example,<br />
construct a confidence interval for the proportion of<br />
individuals who did not complete high school.<br />
4. From Data Set III in Appendix D, select a sample of 30<br />
values <strong>and</strong> construct the 95% <strong>and</strong> 99% confidence intervals<br />
of the mean length in miles of major North American<br />
rivers. Find the mean of all the values, <strong>and</strong> determine if the<br />
confidence intervals contain the mean.<br />
5. From Data Set VI in Appendix D, select a sample of 20<br />
values <strong>and</strong> find the 90% confidence interval of the mean of<br />
the number of acres. Find the mean of all the values, <strong>and</strong><br />
determine if the confidence interval contains the mean.<br />
6. From Data Set XIV in Appendix D, select a sample of<br />
20 weights for the Pittsburgh Steelers, <strong>and</strong> find the<br />
proportion of players who weigh over 250 pounds.<br />
Construct a 95% confidence interval for this proportion.<br />
Find the proportion of all Steelers who weigh more than 250<br />
pounds. Does the confidence interval contain this value?