Confidence Intervals and Sample Size
Confidence Intervals and Sample Size
Confidence Intervals and Sample Size

You also want an ePaper? Increase the reach of your titles
YUMPU automatically turns print PDFs into web optimized ePapers that Google loves.
lu49076_ch07.qxd 5/20/2003 3:16 PM Page 360<br />
360 Chapter 7 <strong>Confidence</strong> <strong>Intervals</strong> <strong>and</strong> <strong>Sample</strong> <strong>Size</strong><br />
Important Terms<br />
chi-square<br />
distribution 354<br />
confidence interval 328<br />
confidence level 328<br />
consistent estimator 327<br />
Important Formulas<br />
7–36<br />
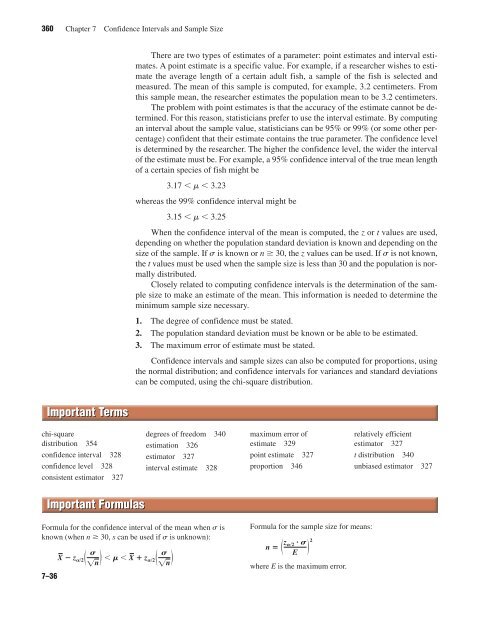
There are two types of estimates of a parameter: point estimates <strong>and</strong> interval estimates.<br />
A point estimate is a specific value. For example, if a researcher wishes to estimate<br />
the average length of a certain adult fish, a sample of the fish is selected <strong>and</strong><br />
measured. The mean of this sample is computed, for example, 3.2 centimeters. From<br />
this sample mean, the researcher estimates the population mean to be 3.2 centimeters.<br />
The problem with point estimates is that the accuracy of the estimate cannot be determined.<br />
For this reason, statisticians prefer to use the interval estimate. By computing<br />
an interval about the sample value, statisticians can be 95% or 99% (or some other percentage)<br />
confident that their estimate contains the true parameter. The confidence level<br />
is determined by the researcher. The higher the confidence level, the wider the interval<br />
of the estimate must be. For example, a 95% confidence interval of the true mean length<br />
of a certain species of fish might be<br />
3.17 � m � 3.23<br />
whereas the 99% confidence interval might be<br />
3.15 � m � 3.25<br />
When the confidence interval of the mean is computed, the z or t values are used,<br />
depending on whether the population st<strong>and</strong>ard deviation is known <strong>and</strong> depending on the<br />
size of the sample. If s is known or n � 30, the z values can be used. If s is not known,<br />
the t values must be used when the sample size is less than 30 <strong>and</strong> the population is normally<br />
distributed.<br />
Closely related to computing confidence intervals is the determination of the sample<br />
size to make an estimate of the mean. This information is needed to determine the<br />
minimum sample size necessary.<br />
1. The degree of confidence must be stated.<br />
2. The population st<strong>and</strong>ard deviation must be known or be able to be estimated.<br />
3. The maximum error of estimate must be stated.<br />
<strong>Confidence</strong> intervals <strong>and</strong> sample sizes can also be computed for proportions, using<br />
the normal distribution; <strong>and</strong> confidence intervals for variances <strong>and</strong> st<strong>and</strong>ard deviations<br />
can be computed, using the chi-square distribution.<br />
degrees of freedom 340<br />
estimation 326<br />
estimator 327<br />
interval estimate 328<br />
Formula for the confidence interval of the mean when s is<br />
known (when n � 30, s can be used if s is unknown):<br />
X � z A�2� S<br />
�n� � M � X � z A�2� S<br />
�n�<br />
maximum error of<br />
estimate 329<br />
point estimate 327<br />
proportion 346<br />
Formula for the sample size for means:<br />
n � � z A�2 � S<br />
E � 2<br />
where E is the maximum error.<br />
relatively efficient<br />
estimator 327<br />
t distribution 340<br />
unbiased estimator 327