Confidence Intervals and Sample Size
Confidence Intervals and Sample Size
Confidence Intervals and Sample Size

You also want an ePaper? Increase the reach of your titles
YUMPU automatically turns print PDFs into web optimized ePapers that Google loves.
lu49076_ch07.qxd 5/20/2003 3:16 PM Page 346<br />
346 Chapter 7 <strong>Confidence</strong> <strong>Intervals</strong> <strong>and</strong> <strong>Sample</strong> <strong>Size</strong><br />
TI-83 Plus<br />
Step by Step<br />
Excel<br />
Step by Step<br />
7–4<br />
<strong>Confidence</strong> <strong>Intervals</strong><br />
<strong>and</strong> <strong>Sample</strong> <strong>Size</strong> for<br />
Proportions<br />
7–22<br />
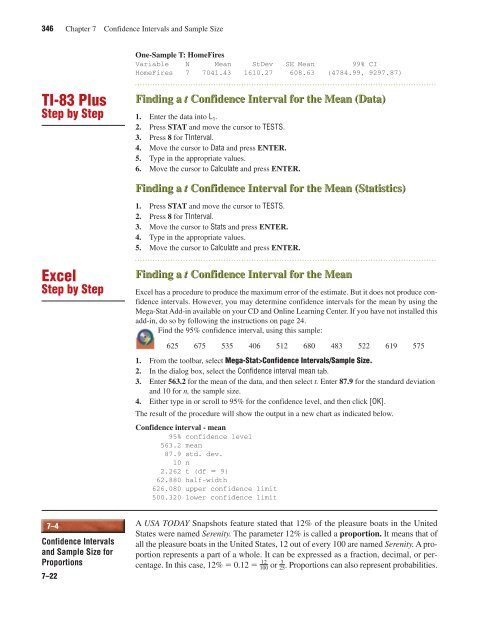
One-<strong>Sample</strong> T: HomeFires<br />
Variable N Mean StDev SE Mean 99% CI<br />
HomeFires 7 7041.43 1610.27 608.63 (4784.99, 9297.87)<br />
Finding a t <strong>Confidence</strong> Interval for the Mean (Data)<br />
1. Enter the data into L 1.<br />
2. Press STAT <strong>and</strong> move the cursor to TESTS.<br />
3. Press 8 for TInterval.<br />
4. Move the cursor to Data <strong>and</strong> press ENTER.<br />
5. Type in the appropriate values.<br />
6. Move the cursor to Calculate <strong>and</strong> press ENTER.<br />
Finding a t <strong>Confidence</strong> Interval for the Mean (Statistics)<br />
1. Press STAT <strong>and</strong> move the cursor to TESTS.<br />
2. Press 8 for TInterval.<br />
3. Move the cursor to Stats <strong>and</strong> press ENTER.<br />
4. Type in the appropriate values.<br />
5. Move the cursor to Calculate <strong>and</strong> press ENTER.<br />
Finding a t <strong>Confidence</strong> Interval for the Mean<br />
Excel has a procedure to produce the maximum error of the estimate. But it does not produce confidence<br />
intervals. However, you may determine confidence intervals for the mean by using the<br />
Mega-Stat Add-in available on your CD <strong>and</strong> Online Learning Center. If you have not installed this<br />
add-in, do so by following the instructions on page 24.<br />
Find the 95% confidence interval, using this sample:<br />
625 675 535 406 512 680 483 522 619 575<br />
1. From the toolbar, select Mega-Stat><strong>Confidence</strong> <strong>Intervals</strong>/<strong>Sample</strong> <strong>Size</strong>.<br />
2. In the dialog box, select the <strong>Confidence</strong> interval mean tab.<br />
3. Enter 563.2 for the mean of the data, <strong>and</strong> then select t. Enter 87.9 for the st<strong>and</strong>ard deviation<br />
<strong>and</strong> 10 for n, the sample size.<br />
4. Either type in or scroll to 95% for the confidence level, <strong>and</strong> then click [OK].<br />
The result of the procedure will show the output in a new chart as indicated below.<br />
<strong>Confidence</strong> interval - mean<br />
95% confidence level<br />
563.2 mean<br />
87.9 std. dev.<br />
10 n<br />
2.262 t (df � 9)<br />
62.880 half-width<br />
626.080 upper confidence limit<br />
500.320 lower confidence limit<br />
A USA TODAY Snapshots feature stated that 12% of the pleasure boats in the United<br />
States were named Serenity. The parameter 12% is called a proportion. It means that of<br />
all the pleasure boats in the United States, 12 out of every 100 are named Serenity. A proportion<br />
represents a part of a whole. It can be expressed as a fraction, decimal, or per-<br />
12 3<br />
centage. In this case, 12% � 0.12 � or . Proportions can also represent probabilities.<br />
100<br />
25