Confidence Intervals and Sample Size
Confidence Intervals and Sample Size
Confidence Intervals and Sample Size

Create successful ePaper yourself
Turn your PDF publications into a flip-book with our unique Google optimized e-Paper software.
lu49076_ch07.qxd 5/20/2003 3:16 PM Page 353<br />
Speaking of<br />
STATISTICS<br />
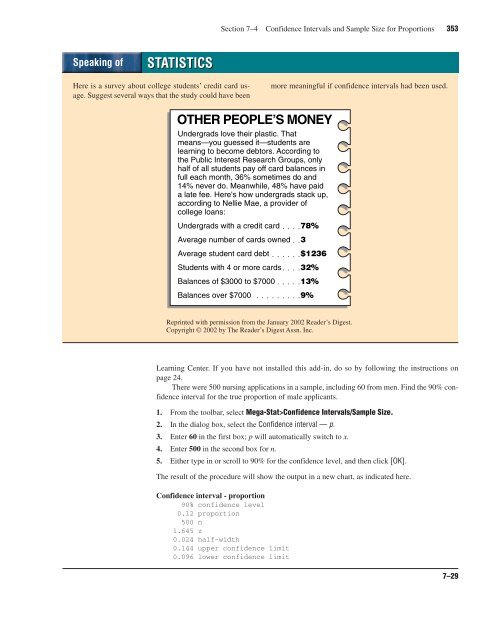
Here is a survey about college students’ credit card usage.<br />
Suggest several ways that the study could have been<br />
Section 7–4 <strong>Confidence</strong> <strong>Intervals</strong> <strong>and</strong> <strong>Sample</strong> <strong>Size</strong> for Proportions 353<br />
OTHER PEOPLE’S MONEY<br />
Undergrads love their plastic. That<br />
means—you guessed it—students are<br />
learning to become debtors. According to<br />
the Public Interest Research Groups, only<br />
half of all students pay off card balances in<br />
full each month, 36% sometimes do <strong>and</strong><br />
14% never do. Meanwhile, 48% have paid<br />
a late fee. Here's how undergrads stack up,<br />
according to Nellie Mae, a provider of<br />
college loans:<br />
Undergrads with a credit card 78%<br />
Average number of cards owned 3<br />
Average student card debt $1236<br />
Students with 4 or more cards 32%<br />
Balances of $3000 to $7000 13%<br />
Balances over $7000 9%<br />
Reprinted with permission from the January 2002 Reader’s Digest.<br />
Copyright © 2002 by The Reader’s Digest Assn. Inc.<br />
Learning Center. If you have not installed this add-in, do so by following the instructions on<br />
page 24.<br />
There were 500 nursing applications in a sample, including 60 from men. Find the 90% confidence<br />
interval for the true proportion of male applicants.<br />
1. From the toolbar, select Mega-Stat><strong>Confidence</strong> <strong>Intervals</strong>/<strong>Sample</strong> <strong>Size</strong>.<br />
2. In the dialog box, select the <strong>Confidence</strong> interval — p.<br />
3. Enter 60 in the first box; p will automatically switch to x.<br />
4. Enter 500 in the second box for n.<br />
5. Either type in or scroll to 90% for the confidence level, <strong>and</strong> then click [OK].<br />
The result of the procedure will show the output in a new chart, as indicated here.<br />
<strong>Confidence</strong> interval - proportion<br />
90% confidence level<br />
0.12 proportion<br />
500 n<br />
1.645 z<br />
0.024 half-width<br />
0.144 upper confidence limit<br />
0.096 lower confidence limit<br />
more meaningful if confidence intervals had been used.<br />
7–29