Confidence Intervals and Sample Size
Confidence Intervals and Sample Size
Confidence Intervals and Sample Size

Create successful ePaper yourself
Turn your PDF publications into a flip-book with our unique Google optimized e-Paper software.
lu49076_ch07.qxd 5/20/2003 3:16 PM Page 355<br />
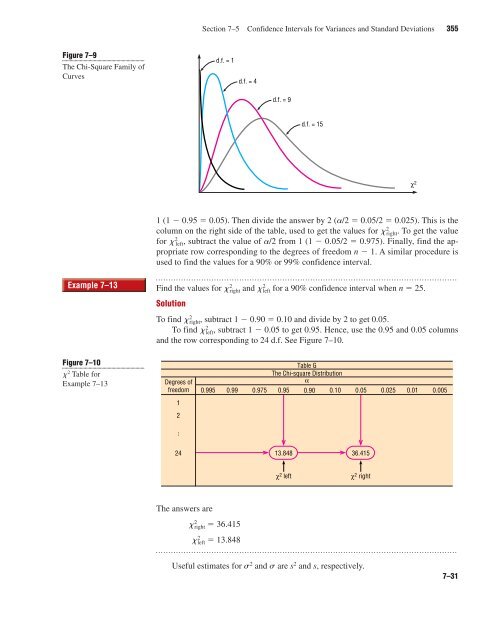
Figure 7–9<br />
The Chi-Square Family of<br />
Curves<br />
Example 7–13<br />
Figure 7–10<br />
x 2 Table for<br />
Example 7–13<br />
1 (1 � 0.95 � 0.05). Then divide the answer by 2 (a/2 � 0.05/2 � 0.025). This is the<br />
column on the right side of the table, used to get the values for x 2 right. To get the value<br />
for x 2 left, subtract the value of a/2 from 1 (1 � 0.05/2 � 0.975). Finally, find the appropriate<br />
row corresponding to the degrees of freedom n � 1. A similar procedure is<br />
used to find the values for a 90% or 99% confidence interval.<br />
Find the values for x2 right <strong>and</strong> x2 left for a 90% confidence interval when n � 25.<br />
Solution<br />
To find x2 right, subtract 1 � 0.90 � 0.10 <strong>and</strong> divide by 2 to get 0.05.<br />
To find x2 left, subtract 1 � 0.05 to get 0.95. Hence, use the 0.95 <strong>and</strong> 0.05 columns<br />
<strong>and</strong> the row corresponding to 24 d.f. See Figure 7–10.<br />
Degrees of<br />
freedom<br />
1<br />
2<br />
...<br />
24<br />
The answers are<br />
x2 right � 36.415<br />
Section 7–5 <strong>Confidence</strong> <strong>Intervals</strong> for Variances <strong>and</strong> St<strong>and</strong>ard Deviations 355<br />
0.995<br />
d.f. = 1<br />
x 2 left � 13.848<br />
d.f. = 4<br />
0.99 0.975<br />
d.f. = 9<br />
13.848<br />
d.f. = 15<br />
Table G<br />
The Chi-square Distribution<br />
α<br />
0.95 0.90 0.10 0.05 0.025 0.01 0.005<br />
36.415<br />
χ 2 left χ 2 right<br />
Useful estimates for s 2 <strong>and</strong> s are s 2 <strong>and</strong> s, respectively.<br />
χ 2<br />
7–31