Drying of wood chips with surplus heat from ... - Skog og landskap
Drying of wood chips with surplus heat from ... - Skog og landskap
Drying of wood chips with surplus heat from ... - Skog og landskap

Create successful ePaper yourself
Turn your PDF publications into a flip-book with our unique Google optimized e-Paper software.
2.1 Measurements<br />
Pushing the boundaries <strong>with</strong> research and<br />
innovation in forest engineering<br />
In order to weigh the chip loads the trailer and the container where placed on the weighing platforms <strong>of</strong><br />
the type WWSE10T. The drying air temperature, relative humidity and the ambient temperature where<br />
registered every half hour. Moisture content samples were taken <strong>from</strong> the chip before and after drying.<br />
Electricity used by the electric fan was measured.<br />
3 Results and discussions<br />
3.1 Temperature and relative humidity<br />
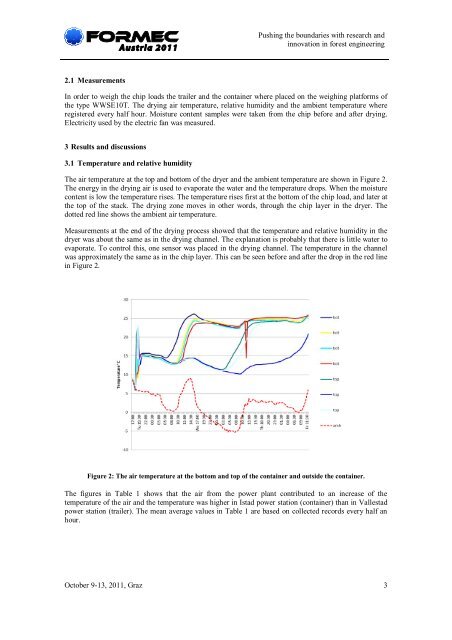
The air temperature at the top and bottom <strong>of</strong> the dryer and the ambient temperature are shown in Figure 2.<br />
The energy in the drying air is used to evaporate the water and the temperature drops. When the moisture<br />
content is low the temperature rises. The temperature rises first at the bottom <strong>of</strong> the chip load, and later at<br />
the top <strong>of</strong> the stack. The drying zone moves in other words, through the chip layer in the dryer. The<br />
dotted red line shows the ambient air temperature.<br />
Measurements at the end <strong>of</strong> the drying process showed that the temperature and relative humidity in the<br />
dryer was about the same as in the drying channel. The explanation is probably that there is little water to<br />
evaporate. To control this, one sensor was placed in the drying channel. The temperature in the channel<br />
was approximately the same as in the chip layer. This can be seen before and after the drop in the red line<br />
in Figure 2.<br />
Figure 2: The air temperature at the bottom and top <strong>of</strong> the container and outside the container.<br />
The figures in Table 1 shows that the air <strong>from</strong> the power plant contributed to an increase <strong>of</strong> the<br />
temperature <strong>of</strong> the air and the temperature was higher in Istad power station (container) than in Vallestad<br />
power station (trailer). The mean average values in Table 1 are based on collected records every half an<br />
hour.<br />
October 9-13, 2011, Graz 3