Goose Creek Watershed Management Plan Version - Charlotte ...
Goose Creek Watershed Management Plan Version - Charlotte ...
Goose Creek Watershed Management Plan Version - Charlotte ...

Create successful ePaper yourself
Turn your PDF publications into a flip-book with our unique Google optimized e-Paper software.
<strong>Goose</strong> <strong>Creek</strong> <strong>Watershed</strong><br />
<strong>Management</strong> <strong>Plan</strong><br />
Sediment entering Mountain Island Lake from <strong>Goose</strong> <strong>Creek</strong> Cove<br />
Completed by: <strong>Charlotte</strong>-Mecklenburg Storm Water Services<br />
<strong>Version</strong> 1<br />
October 31, 2009
<strong>Goose</strong> <strong>Creek</strong> <strong>Watershed</strong><br />
<strong>Management</strong> <strong>Plan</strong><br />
<strong>Version</strong> 1<br />
Completed by:<br />
<strong>Charlotte</strong>-Mecklenburg Storm Water Services<br />
Water Quality Program Staff<br />
Date Completed:<br />
October 31, 2009
<strong>Goose</strong> <strong>Creek</strong> <strong>Watershed</strong> <strong>Management</strong> <strong>Plan</strong> <strong>Version</strong> 1...………………...October 31, 2009<br />
Table of Contents<br />
Executive Summary ...........................................................................................................1<br />
Section 1 Introduction ................................................................................................2<br />
1.1 Purpose .........................................................................................................2<br />
1.2 Background ..................................................................................................2<br />
Section 2 Current and Historical Conditions...........................................................8<br />
2.1 Previous Work .............................................................................................8<br />
2.1.1 Fecal Coliform TMDL .................................................................................9<br />
2.1.2 Water Quality Recovery Program ................................................................9<br />
2.1.3 NC DOT .......................................................................................................9<br />
2.1.4 <strong>Charlotte</strong> Mecklenburg Utilities ..................................................................9<br />
2.1.5 North Carolina Ecosystem Enhancement Program ....................................10<br />
2.2 Existing Conditions ....................................................................................11<br />
2.2.1 Water Chemistry ........................................................................................10<br />
2.2.2 Biological ...................................................................................................11<br />
2.2.3 Physical ......................................................................................................14<br />
2.2.4 Stream Flow ...............................................................................................13<br />
2.2.5 Land Use/Land Cover ................................................................................13<br />
2.2.6 Soils............................................................................................................15<br />
2.3 Current <strong>Watershed</strong> Protection Efforts ........................................................16<br />
2.3.1 S.W.I.M. Buffer Ordinance........................................................................16<br />
2.3.2 Post Construction Buffers ..........................................................................17<br />
2.3.3 <strong>Goose</strong> <strong>Creek</strong> <strong>Watershed</strong> Site Specific <strong>Management</strong> <strong>Plan</strong> .........................18<br />
2.3.4 BMP Retrofits and Land Acquisition ........................................................19<br />
2.3.5 Existing NPDES Permitted WWTPs .........................................................20<br />
Section 3 <strong>Watershed</strong> Indicators and Goals ............................................................21<br />
3.1 Upland ........................................................................................................21<br />
3.1.1 Upland Water Quality Indicators ...............................................................21<br />
3.1.2 Upland Water Quality Goals ......................................................................21<br />
3.2 In-Stream....................................................................................................22<br />
3.2.1 In-Stream Water Quality Indicators ...........................................................22<br />
3.2.2 In-Stream Water Quality Goals .................................................................22<br />
3.3 Channel ......................................................................................................28<br />
3.3.1 Stream Channel Indicators .........................................................................29<br />
3.3.2 Stream Channel Goals................................................................................30<br />
Section 4 <strong>Watershed</strong> Assessment ............................................................................24<br />
4.1 Upland Characterization ............................................................................24<br />
4.1.1 Methodology ..............................................................................................24<br />
4.1.2 Results ........................................................................................................29<br />
4.2 Stream Channel Characterization ..............................................................36<br />
4.2.1 Methodology ..............................................................................................36<br />
4.2.2 Results ........................................................................................................39<br />
i
<strong>Goose</strong> <strong>Creek</strong> <strong>Watershed</strong> <strong>Management</strong> <strong>Plan</strong> <strong>Version</strong> 1...………………...October 31, 2009<br />
4.3 Fecal Coliform Assessment .......................................................................41<br />
Section 5 Candidate Restoration, Retrofit & Preservation Sites .........................42<br />
5.1 Upland BMP Retrofit Sites ........................................................................42<br />
5.1.1 Priority Basins ............................................................................................42<br />
5.1.2 Public Parcels .............................................................................................45<br />
5.2 Stream Channel <strong>Management</strong> Opportunities .............................................52<br />
5.3 Stream Buffer Restoration Areas ...............................................................51<br />
5.4 Master <strong>Plan</strong>ning for Restoration, Retrofit and Preservation Projects ........61<br />
Section 6 Measuring Success and Adaptive <strong>Management</strong> ....................................62<br />
6.1 Establishing an Ongoing Water Quality Monitoring Program ..................62<br />
6.2 Annual Status Report .................................................................................62<br />
6.3 Adaptive <strong>Management</strong> ...............................................................................62<br />
Section 7 Conclusion ................................................................................................63<br />
List of Tables:<br />
Table 1 General <strong>Goose</strong> <strong>Creek</strong> <strong>Watershed</strong> Statistics .....................................................1<br />
Table 2 <strong>Goose</strong> <strong>Creek</strong> Stream Class Descriptions .........................................................7<br />
Table 3 <strong>Goose</strong> <strong>Creek</strong> Water Quality Standards ...........................................................8<br />
Table 4 Baseflow Water Chemistry Statistics ............................................................10<br />
Table 5 NCDENR Macroinvertebrate Sample Results ..............................................12<br />
Table 6 <strong>Goose</strong> <strong>Creek</strong> Land Use Categories ...............................................................14<br />
Table 7 Hydrologic Soil Groups Found Within <strong>Goose</strong> <strong>Creek</strong> <strong>Watershed</strong> .................15<br />
Table 8 S.W.I.M. Buffer Requirements for the <strong>Goose</strong> <strong>Creek</strong> <strong>Watershed</strong>..................17<br />
Table 9 NPDES Permitted Dischargers in the <strong>Goose</strong> <strong>Creek</strong> <strong>Watershed</strong> ...................20<br />
Table 10 Upland Pollutant Loading Rate Goals ..........................................................21<br />
Table 11 In-Stream Water Quality Goals ....................................................................23<br />
Table 12 <strong>Goose</strong> <strong>Creek</strong> Land Use Categories and Abbreviations .................................25<br />
Table 13 Upland Pollutant Loading Rates by Land Use ..............................................27<br />
Table 14 Catchment Loading Rates .............................................................................27<br />
Table 15 Catchment Area, Impervious Area and Impervious Percentages .................28<br />
Table 16 Results of the Upland Characterization ........................................................29<br />
Table 17 Results of Stream Channel Characterization ................................................40<br />
Table 18 Public Parcels Meeting BMP Criteria and Priority .......................................49<br />
Table 19 Highest Priority <strong>Goose</strong> <strong>Creek</strong> Stream Reaches ............................................53<br />
Table 20 Results of the Stream Buffer Tree Canopy Analysis ....................................60<br />
List of Figures:<br />
Figure 1 Mecklenburg County <strong>Watershed</strong> and Jurisdictional Boundaries ....................3<br />
Figure 2 Special Features within the <strong>Goose</strong> <strong>Creek</strong> <strong>Watershed</strong> .....................................4<br />
Figure 3 Typical Residential Development in the <strong>Goose</strong> <strong>Creek</strong> <strong>Watershed</strong> .................5<br />
Figure 4 Typical New Residential Development in the <strong>Goose</strong> <strong>Creek</strong> <strong>Watershed</strong> ........6<br />
Figure 5 Percent Exceeding Graph for <strong>Goose</strong> <strong>Creek</strong> Samples ....................................11<br />
ii
<strong>Goose</strong> <strong>Creek</strong> <strong>Watershed</strong> <strong>Management</strong> <strong>Plan</strong> <strong>Version</strong> 1...………………...October 31, 2009<br />
Figure 6 Historical SUSI Scores for <strong>Goose</strong> <strong>Creek</strong> ......................................................11<br />
Figure 7 <strong>Goose</strong> <strong>Creek</strong> Benthic Macroinvertebrate Scores ..........................................12<br />
Figure 8 Distribution of Land Uses in the <strong>Goose</strong> <strong>Creek</strong> <strong>Watershed</strong> ...........................15<br />
Figure 9 Distribution of Hydrologic Soil Groups in the <strong>Goose</strong> <strong>Creek</strong> <strong>Watershed</strong>......16<br />
Figure 10 Approximate Extent of the <strong>Goose</strong> <strong>Creek</strong> <strong>Watershed</strong> S.W.I.M. Buffers .......17<br />
Figure 11 Approximate Extent of the <strong>Goose</strong> <strong>Creek</strong> Post Construction Buffers ...........18<br />
Figure 12 Public Property in the <strong>Goose</strong> <strong>Creek</strong> <strong>Watershed</strong> ............................................19<br />
Figure 13 <strong>Goose</strong> <strong>Creek</strong> <strong>Watershed</strong> Catchments ............................................................26<br />
Figure 14 Distribution of Buffers in the <strong>Goose</strong> <strong>Creek</strong> <strong>Watershed</strong> ................................28<br />
Figure 15 Fecal Coliform Rank .....................................................................................30<br />
Figure 16 TN Ranking ...................................................................................................31<br />
Figure 17 TP Ranking ...................................................................................................32<br />
Figure 18 TSS Ranking .................................................................................................33<br />
Figure 19 NH4 Ranking ................................................................................................34<br />
Figure 20 Cu Ranking ...................................................................................................35<br />
Figure 21 Overall Impairment .......................................................................................36<br />
Figure 22 <strong>Goose</strong> <strong>Creek</strong> Stream Channel Characterization Reaches .............................39<br />
Figure 23 Focus Basins with the <strong>Goose</strong> <strong>Creek</strong> <strong>Watershed</strong> ...........................................42<br />
Figure 24 Focus Basin 11 ..............................................................................................43<br />
Figure 25 Focus Basin 2 ................................................................................................44<br />
Figure 26 Focus Basin 5 ................................................................................................45<br />
Figure 27 Focus Basin 4 ................................................................................................46<br />
Figure 28 Focus Basin 6 ................................................................................................47<br />
Figure 29 <strong>Goose</strong> <strong>Creek</strong> <strong>Watershed</strong> Public Parcels ........................................................49<br />
Figure 30 Aerial Photo of Parcels 19514219, 19514129 and 19514208 .......................50<br />
Figure 31 Aerial Photo of Parcel 19701146 ..................................................................51<br />
Figure 32 Aerial Photo of Parcels 19720111 and 19720106 .........................................52<br />
Figure 33 Reach DSTOUS296 Area Map .....................................................................54<br />
Figure 34 Reach DSTOUS329 Area Map .....................................................................55<br />
Figure 35 Reach DSTOUS357 Area Map .....................................................................56<br />
Figure 36 Reach DSTOUS299 Area Map .....................................................................57<br />
Figure 37 Reach DSTOUS142 Area Map .....................................................................58<br />
Figure 38 Reach DSTOUS184 Area Map .....................................................................59<br />
Figure 39 Results of the Tree Canopy Analysis ............................................................60<br />
Appendices<br />
Appendix A: References ...................................................................................................64<br />
iii
<strong>Goose</strong> <strong>Creek</strong> <strong>Watershed</strong> <strong>Management</strong> <strong>Plan</strong> <strong>Version</strong> 1...………………...October 31, 2009<br />
Executive Summary<br />
The <strong>Goose</strong> <strong>Creek</strong> <strong>Watershed</strong> is located in southeastern Mecklenburg County and is<br />
almost entirely within the town limits or extraterritorial jurisdiction of Mint Hill. The<br />
watershed has been designated as habitat for the federally listed endangered Carolina<br />
Heelsplitter Mussel. This designation has brought about the implementation of a Site<br />
Specific <strong>Management</strong> <strong>Plan</strong> for new development in the watershed. In addition to the<br />
issues surrounding the Carolina Heelsplitter, the municipalities within the <strong>Watershed</strong><br />
were required to develop a Water Quality Recovery Program for Fecal Coliform, which<br />
was the result of a Fecal Coliform TMDL. In addition to Fecal Coliform, the watershed<br />
is also identified on the NC 303(d) list for impaired biological integrity, likely a result of<br />
hydro-modification of the stream channel. Table 1 presents general statistics for the<br />
<strong>Goose</strong> <strong>Creek</strong> <strong>Watershed</strong>.<br />
Table 1: General <strong>Goose</strong> <strong>Creek</strong> <strong>Watershed</strong> Statistics (portion of <strong>Goose</strong> <strong>Creek</strong> within<br />
Mecklenburg County).<br />
Estimated <strong>Goose</strong> <strong>Creek</strong> <strong>Watershed</strong><br />
5616<br />
Population<br />
<strong>Goose</strong> <strong>Creek</strong> <strong>Watershed</strong> Area 6975 acres<br />
Stream Miles (Draining > 50 acres) 28 miles<br />
Dominant Land Uses<br />
Major Political Jurisdictions Town of Mint Hill<br />
Major Streams in the <strong>Goose</strong> <strong>Creek</strong><br />
<strong>Watershed</strong><br />
Rural Residential 34%<br />
Vacant 31%<br />
Low Density Residential 11%<br />
Medium/Low Density<br />
Residential 9%<br />
Transportation 8%<br />
<strong>Goose</strong> <strong>Creek</strong><br />
Duck <strong>Creek</strong><br />
Stevens <strong>Creek</strong><br />
1<br />
Sediment entering Mountain Island Lake from <strong>Goose</strong> <strong>Creek</strong> Cove
<strong>Goose</strong> <strong>Creek</strong> <strong>Watershed</strong> <strong>Management</strong> <strong>Plan</strong> <strong>Version</strong> 1...………………...October 31, 2009<br />
SECTION 1. INTRODUCTION<br />
1.1 Purpose<br />
The purpose of this <strong>Watershed</strong> <strong>Management</strong> <strong>Plan</strong> is to guide restoration, retrofit and<br />
preservation efforts aimed at achieving specific goals for improving water quality<br />
conditions in the <strong>Goose</strong> <strong>Creek</strong> <strong>Watershed</strong> in Mecklenburg County such that these waters<br />
meet or exceed their State designated uses and are no longer rated as impaired on 303(d)<br />
lists. Moreover, the plan seeks to restore the population of Lasmigona Decorata<br />
(Carolina Heelsplitter), a federally endangered freshwater mussel, in the watershed.<br />
This <strong>Watershed</strong> <strong>Management</strong> <strong>Plan</strong> seeks to:<br />
1. Summarize important information regarding the <strong>Goose</strong> <strong>Creek</strong> <strong>Watershed</strong> relative to<br />
water quality.<br />
2. Describe current and historical water quality conditions in the watershed.<br />
3. Describe current and previous efforts in the watershed to protect and restore water<br />
quality.<br />
4. Describe water quality goals for the watershed.<br />
5. Prioritize areas for restoration, retrofit and preservation efforts aimed at achieving<br />
water quality goals.<br />
6. Describe the process forward for implementing water quality efforts.<br />
The ultimate goal after complete implementation of this <strong>Watershed</strong> <strong>Management</strong> <strong>Plan</strong> is a<br />
fully functioning and supporting stream ecosystem in <strong>Goose</strong> <strong>Creek</strong>.<br />
1.2 Background<br />
The headwaters of the <strong>Goose</strong> <strong>Creek</strong> <strong>Watershed</strong> (including <strong>Goose</strong>, Duck and Stevens<br />
<strong>Creek</strong>s) are located in the southeastern portion of Mecklenburg County and lies within<br />
Mint Hill’s jurisdiction. The creek flows from Mecklenburg County to the southeast into<br />
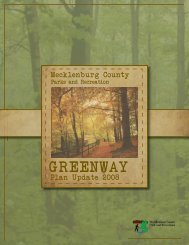
Union County and subsequently enters the Yadkin River in Union County. Figure 1<br />
shows the location of the <strong>Goose</strong> <strong>Creek</strong> <strong>Watershed</strong> in Mecklenburg County along with its<br />
jurisdictional boundaries. Figure 2 presents a close up view of the <strong>Goose</strong> <strong>Creek</strong><br />
<strong>Watershed</strong>.<br />
2
<strong>Goose</strong> <strong>Creek</strong> <strong>Watershed</strong> <strong>Management</strong> <strong>Plan</strong> <strong>Version</strong> 1...………………...October 31, 2009<br />
Lake Wylie<br />
McDowell<br />
Up Mtn Island Torrence<br />
Low Mtn Island<br />
Steele<br />
Lake Norman<br />
Paw<br />
Long<br />
Taggart<br />
Gar<br />
Coffey Sugar<br />
Stewart<br />
Kings<br />
L Sugar<br />
Up Irwin<br />
McAlpine<br />
W Br Rocky<br />
Briar<br />
3<br />
Clarke<br />
Up L Sugar<br />
McMullen<br />
Mallard<br />
Mid McAlpine<br />
Six Mile<br />
Four Mile<br />
Back<br />
Reedy<br />
Campbell<br />
Up McAlpine<br />
McKee Caldwell<br />
Irvins<br />
Legend<br />
<strong>Goose</strong><br />
<strong>Charlotte</strong><br />
Cornelius<br />
Davidson<br />
Huntersville<br />
Matthews<br />
Mecklenburg<br />
Mint Hill<br />
Pineville<br />
Stallings<br />
Clear<br />
Duck<br />
<strong>Goose</strong> <strong>Creek</strong> <strong>Watershed</strong><br />
Figure 1: Mecklenburg County <strong>Watershed</strong>s and Jurisdictional Boundaries.
<strong>Goose</strong> <strong>Creek</strong> <strong>Watershed</strong> <strong>Management</strong> <strong>Plan</strong> <strong>Version</strong> 1...………………...October 31, 2009<br />
Figure 2: Special Features within the <strong>Goose</strong> <strong>Creek</strong> <strong>Watershed</strong>. Note: MY9, MY9A,<br />
MY9B denote Mecklenburg County water quality monitoring sites.<br />
Historically, land in the <strong>Goose</strong> <strong>Creek</strong> <strong>Watershed</strong> was used for agriculture. However,<br />
within the past 20-30 years the population of the watershed has increased. Figure 3<br />
shows a typical older residential development in the <strong>Watershed</strong> and Figure 4 shows more<br />
recent development. In addition to agricultural land-use, large lot residential and some<br />
commercial/institutional centered around Highway 51 and Lawyers Road are now<br />
notable. The relatively recent construction of 485 is expected to attract dense<br />
development at the Idlewild Road, Lawyers Road and Fairview Road exits. In fact, at the<br />
northeast corner of Lawyers Road and 485 a new mall (The Bridges) is under<br />
construction (currently on hold). In addition to the recent changes brought about by<br />
urbanization, drastic changes to the stream system have occurred in the last century. At<br />
some point in the past, the portions of <strong>Goose</strong> <strong>Creek</strong> were straightened either to prevent<br />
flooding or to improve the land for agricultural uses (<strong>Charlotte</strong>-Mecklenburg Storm<br />
Water Services, 1997).<br />
Figure 3: Typical Residential Development in the <strong>Goose</strong> <strong>Creek</strong> <strong>Watershed</strong>.<br />
4
<strong>Goose</strong> <strong>Creek</strong> <strong>Watershed</strong> <strong>Management</strong> <strong>Plan</strong> <strong>Version</strong> 1...………………...October 31, 2009<br />
JOLI CHEVAL<br />
PRAIRIE HILL<br />
HEATH GLEN<br />
JOLI CHEVAL<br />
TWINLEAF<br />
HEATH LAKE<br />
WINTER HEATH<br />
EARLY MEADOW<br />
OXER<br />
Figure 4: Typical New Residential Development in the <strong>Goose</strong> <strong>Creek</strong> <strong>Watershed</strong>.<br />
<strong>Goose</strong> <strong>Creek</strong> is listed in the 2006 North Carolina 303(d) list (North Carolina, 2004) as<br />
being impaired for fecal coliform . A total of 16.3 miles of <strong>Goose</strong> <strong>Creek</strong> are identified in<br />
the list, which includes the entire stream from its source to the Rocky River. Typically<br />
streams are listed on the 303(d) list dependant upon their intended uses. Intended uses<br />
are generally determined through the stream class. <strong>Goose</strong> <strong>Creek</strong> is a Class C Stream (see<br />
Table 2). In North Carolina, surface water quality regulations are defined for particular<br />
classes of use support. For instance, Class C waters must support aquatic life and<br />
secondary recreation (infrequent human body contact), while Class B waters must<br />
support aquatic life and primary recreation (frequent human body contact or swimming).<br />
Individual streams, lakes, and reservoirs (or portions of each) are assigned one or more<br />
classes. All of the contributing streams to a body of water receive the same designation<br />
when they are not specifically defined. Each class has a set of regulations, including<br />
water quality standards associated with it. If chemical/physical water quality monitoring<br />
reveals that a stream is not meeting a water quality standard, then it is considered<br />
“Impaired.” If biological monitoring indicates a lack of abundance and/or diversity of<br />
aquatic life in a stream, then it is considered as having “Impaired biological integrity.”<br />
Impaired streams are placed on the 303(d) list and a restoration method is specified such<br />
as the development of a total maximum daily load or TMDL.<br />
5<br />
LAWYERS<br />
FOX HOLLOW<br />
HELENA<br />
THOMPSON<br />
BAIN SCHOOL
<strong>Goose</strong> <strong>Creek</strong> <strong>Watershed</strong> <strong>Management</strong> <strong>Plan</strong> <strong>Version</strong> 1...………………...October 31, 2009<br />
A TMDL was written by the Mecklenburg County Water Quality Program (now know as<br />
<strong>Charlotte</strong>/Mecklenburg Storm Water Services (CMSWS)) in April 2005 and<br />
subsequently approved by the USEPA on July 8, 2005. The TMDL will be discussed at<br />
length in the next section of this document (Section 2).<br />
Table 2: <strong>Goose</strong> <strong>Creek</strong> Stream Class Descriptions.<br />
Stream<br />
Description<br />
Class<br />
C Freshwaters protected for secondary recreation, fishing, aquatic life<br />
including propagation and survival, and wildlife. All freshwaters shall<br />
be classified to protect these uses at a minimum.<br />
6
<strong>Goose</strong> <strong>Creek</strong> <strong>Watershed</strong> <strong>Management</strong> <strong>Plan</strong> <strong>Version</strong> 1...………………...October 31, 2009<br />
SECTION 2. CURRENT AND HISTORICAL CONDITIONS<br />
2.1 Previous Work<br />
Approximate Event Timeline for the <strong>Goose</strong> <strong>Creek</strong> <strong>Watershed</strong><br />
June 30, 1993: Carolina Heelsplitter included on the Endangered Species list. <strong>Goose</strong><br />
<strong>Creek</strong> named as habitat for a small population.<br />
January 17, 1997: Completion of the Recovery <strong>Plan</strong> for the Carolina Heelsplitter.<br />
August 20, 2001: Mitigated Finding of No Significant Impact – <strong>Charlotte</strong>- Mecklenburg<br />
Utilities Proposed Increase in Interbasin Transfer from the Catawba River Basin<br />
to the Rocky River Basin.<br />
March 14, 2000: EMC decision to approve the IBT with conditions. Condition #3<br />
placed a “…moratorium on the installation of new interbasin transfer water<br />
lines… into the <strong>Goose</strong> <strong>Creek</strong> subbasin…until the impacts of additional urban<br />
growth on the (Carolina heelsplitter) are fully evaluated." This ruling effectively<br />
halted expansion of the supply of public water in the <strong>Goose</strong> <strong>Creek</strong> <strong>Watershed</strong>.<br />
April, 2005: Final <strong>Goose</strong> <strong>Creek</strong> TMDL Submitted to USEPA<br />
July 8, 2005: USEPA Approval of <strong>Goose</strong> <strong>Creek</strong> Fecal Coliform TMDL<br />
August 10, 2006: Letter from NCDENR to Mecklenburg County, Mint Hill, Stallings<br />
and Indian Trail requiring the development of a Water Quality Recovery Program<br />
for implementation of the <strong>Goose</strong> <strong>Creek</strong> Fecal Coliform TMDL.<br />
September 15, 2006: NC Court Decision (Filed October 13, 2006) requiring, among<br />
other things, that the NPDES permits for Stallings, Indian Trail, Mint Hill and<br />
Mecklenburg County be reopened and amended to include measures to protect the<br />
Carolina Heelsplitter. Among these are water quality standards for ammonia,<br />
copper, nitrate-nitrite and phosphorus. The document identifies standards<br />
presented in Table 3.<br />
Table 3: <strong>Goose</strong> <strong>Creek</strong> Water Quality Standards<br />
Constituent Chronic Standard Acute Standard<br />
Phosphorus 0.1 mg/L<br />
Nitrate-nitrite 0.4 mg/L<br />
Copper 2.2 ug/L 3.6 ug/L<br />
Ammonia 0.5 mg/L 1.75 mg/L<br />
June 30, 2007: Implementation of Mint Hill’s Post Construction Ordinances, which<br />
currently guide land development in the <strong>Goose</strong> <strong>Creek</strong> <strong>Watershed</strong>.<br />
7
<strong>Goose</strong> <strong>Creek</strong> <strong>Watershed</strong> <strong>Management</strong> <strong>Plan</strong> <strong>Version</strong> 1...………………...October 31, 2009<br />
February 1, 2009: Implementation of the Site Specific <strong>Management</strong> <strong>Plan</strong> for the <strong>Goose</strong><br />
<strong>Creek</strong> <strong>Watershed</strong>. This <strong>Plan</strong> guides all development in the watershed, eliminating<br />
the Mint Hill Post Construction Ordinance.<br />
2.1.1 <strong>Goose</strong> <strong>Creek</strong> Fecal Coliform TMDL<br />
In April 2005, Mecklenburg County, under contract with the State of North Carolina,<br />
completed a TMDL for fecal coliform for <strong>Goose</strong> <strong>Creek</strong>, North Carolina. The TMDL was<br />
subsequently approved by the USEPA on July 8, 2005. A copy of the TMDL is available<br />
at the following website:<br />
http://h2o.enr.state.nc.us/tmdl/documents/<strong>Goose</strong>Ck.FCTMDLApprovedbyEPAJuly0805.<br />
pdf<br />
The TMDL specified fecal coliform load reductions to both permitted MS4s in the<br />
watershed and non-point sources of pollution. Essentially, the TMDL specifies load<br />
reductions of 92.5% for all sources of fecal coliform with the exception of WWTPs,<br />
whose allocation remained unchanged at permitted levels (200 c.f.u./100 ml).<br />
2.1.2 Water Quality Recovery Program<br />
On August 10, 2006 NC DENR submitted a letter to the permitted MS4s in the <strong>Goose</strong><br />
<strong>Creek</strong> <strong>Watershed</strong> requiring them to develop a Water Quality Program (WQRP) for Fecal<br />
Coliform in the <strong>Goose</strong> <strong>Creek</strong> <strong>Watershed</strong>. Mecklenburg County partnered with the towns<br />
of Mint Hill, NC, Stallings, NC and Indian Trail, NC to develop the WQRP. The WQRP<br />
document, which describes each of the components of the program is included with this<br />
document as Appendix XX.<br />
2.1.3 NC DOT<br />
In September, 2004 Craig Allan (Department of Geography and Earth Sciences, UNC<br />
<strong>Charlotte</strong>) completed a report entitled Water Quality and Stream Stability Monitoring for<br />
<strong>Goose</strong> <strong>Creek</strong> Mecklenburg and Union Counties, North Carolina 2001-2003. The study<br />
was funded by the United States Department of Transportation to study the impacts of the<br />
construction of I-485 through the <strong>Goose</strong> <strong>Creek</strong> <strong>Watershed</strong> in Mecklenburg County.<br />
Allan cites hydromodification of the stream channel itself as a primary source of elevated<br />
TSS and turbidity levels measured during storm events. Similarly, Allan (2004) cited<br />
increased levels of phosphorus and nitrogen in storm flow.<br />
2.1.4 <strong>Charlotte</strong>-Mecklenburg Utilities<br />
<strong>Charlotte</strong> Mecklenburg Utilities initiated a study with the goal of establishing a Finding<br />
of No Significant Impact (FONSI) for the construction of a regional WWTP in the <strong>Goose</strong><br />
<strong>Creek</strong> <strong>Watershed</strong>. The study was never completed because of the requirements put in<br />
8
<strong>Goose</strong> <strong>Creek</strong> <strong>Watershed</strong> <strong>Management</strong> <strong>Plan</strong> <strong>Version</strong> 1...………………...October 31, 2009<br />
place to protect the Carolina Heelsplitter Mussel essentially prohibited construction of the<br />
plant.<br />
2.1.5 North Carolina Ecosystem Enhancement Program<br />
The North Carolina Ecosystem Enhancement Program (EEP) is currently conducting a<br />
study in the <strong>Goose</strong> <strong>Creek</strong> <strong>Watershed</strong> to establish a Local Area <strong>Watershed</strong> <strong>Plan</strong> (LAWP)<br />
to identify mitigation opportunities in the <strong>Watershed</strong>. In the past, EEP LAWPs have not<br />
met the needs of local governments in Mecklenburg County however the process has<br />
been modified and may provide useful information. No completion date was available at<br />
the time of preparation of this document. EEP has established a stakeholder group of<br />
technical resources that is participating in their process. They intend for the stakeholder<br />
group to assume the role of implementing the findings of the LAWP that are not pertinent<br />
to EEP goals. These findings may include ordinance modification, BMP construction,<br />
stream enhancement or restoration and education efforts.<br />
2.2.1 Water Chemistry<br />
<strong>Goose</strong> <strong>Creek</strong> baseflow samples are collected from MY9A, MY9B and MY9 (Figure 2).<br />
Table 4 presents a condensed set of information from the historical data collected at these<br />
sites. TN exceedances were detected 27% of the time and TP exceedences were detected<br />
8% of the time. Fecal coliform concentrations in excess of 200 c.f.u./100 ml were<br />
detected approximately 82% of the time. Additionally, copper exceedences were<br />
recorded in 68% of the samples and ammonia in 7% of the samples. Figure 5 shows the<br />
percentages of these exceedances. Stream Use Support Index (SUSI) values have tended<br />
to oscillate since 2007 but have remained below threshold values, which is a strong<br />
indicator of a non-supporting watershed (Figure 6). The most notable reason for the<br />
lowest values is the extreme drought that has occurred in the piedmont of North Carolina<br />
in the past several years.<br />
Table 4: Baseflow Water Chemistry Statistics.<br />
All <strong>Goose</strong> <strong>Creek</strong> Monitoring<br />
Sites<br />
Total N Total P TSS<br />
Fecal<br />
Coliform<br />
Action Level: 1.5 ppm 0.4 ppm 50 200<br />
cfu/100Ml<br />
9<br />
Ammonia<br />
Copper<br />
2.2 ug/L 0.5<br />
Sample size 186 202 48 463 121 204<br />
MIN 0.35 0.02 2 1 2 0.05<br />
MAX 10.5 2.1 43 58000 36 2.5<br />
MEAN 1.5 0.2 5.2 2398 6.2 0.22<br />
MEDIAN 1.1 0.13 2.8 500 3.6 0.10<br />
% samples over Action Level 27% 8% 0% 82% 68% 7%
<strong>Goose</strong> <strong>Creek</strong> <strong>Watershed</strong> <strong>Management</strong> <strong>Plan</strong> <strong>Version</strong> 1...………………...October 31, 2009<br />
% Exceeding Action Level<br />
Figure 5: Percent Exceeding Graph for <strong>Goose</strong> <strong>Creek</strong> Samples.<br />
80<br />
78<br />
76<br />
74<br />
72<br />
70<br />
68<br />
66<br />
64<br />
62<br />
100%<br />
90%<br />
80%<br />
70%<br />
60%<br />
50%<br />
40%<br />
30%<br />
20%<br />
10%<br />
0%<br />
6/13/07<br />
7/18/07<br />
8/8/07<br />
Figure 6: Historical SUSI Scores for <strong>Goose</strong> <strong>Creek</strong><br />
2.2.2 Biological<br />
<strong>Goose</strong> <strong>Creek</strong> % Exceeding Graph<br />
Total N Total P TSS Fecal<br />
Coliform<br />
9/19/07<br />
10/17/07<br />
Currently, the benthic macroinvertebrate community in <strong>Goose</strong> <strong>Creek</strong> is monitored<br />
annually by Mecklenburg County at Stevens Mill Road in Union County (site MY9).<br />
Previously, samples were collected at MY9A and MY9B, which are just upstream of I-<br />
10<br />
Analyte<br />
MY9 vs. SUSI<br />
SUSI Threshold Successful Exemplary MY9<br />
11/14/07<br />
12/19/07<br />
1/16/08<br />
2/20/08<br />
3/12/08<br />
4/16/08<br />
5/22/08<br />
6/18/08<br />
7/16/08<br />
8/20/08<br />
Copper Ammonia<br />
9/17/08<br />
10/15/08<br />
11/19/08<br />
12/16/08<br />
1/22/09
<strong>Goose</strong> <strong>Creek</strong> <strong>Watershed</strong> <strong>Management</strong> <strong>Plan</strong> <strong>Version</strong> 1...………………...October 31, 2009<br />
485 on <strong>Goose</strong> and Stevens <strong>Creek</strong>s respectively (Figure 2). The EPT taxa richness was<br />
generally below 10 species for all samples taken since 1999 in <strong>Goose</strong> <strong>Creek</strong>. Figure 7<br />
presents the benthic macrinvertebrate scores for <strong>Goose</strong> <strong>Creek</strong> since 1995. As can be<br />
discerned from the graph, <strong>Goose</strong> <strong>Creek</strong> has exhibited a general decline in its<br />
macroinvertebrate population. However, it is important to note that the<br />
macroinvertebrate populations in <strong>Goose</strong> <strong>Creek</strong> are very sensitive to drought as <strong>Goose</strong><br />
<strong>Creek</strong> tends to dry up more readily than other creeks with a similar drainage area. This is<br />
likely due to the drainage area being partially within the Carolina Slate Belt<br />
EPT Taxa Richness<br />
25<br />
20<br />
15<br />
10<br />
5<br />
0<br />
July<br />
1995<br />
MY9A<br />
MY9B<br />
MY9<br />
May<br />
1998<br />
July<br />
1999<br />
June<br />
2000<br />
June<br />
2001<br />
July<br />
2002<br />
Date<br />
Figure 7: <strong>Goose</strong> <strong>Creek</strong> Benthic Macroinvertebrate Scores.<br />
The N.C. Department of Environment and Natural Resources (NCDENR) performs<br />
monitoring for macroinvertebrates and the Carolina Heelsplitter in <strong>Goose</strong> <strong>Creek</strong>. The<br />
macroinvertebrate sample results are presented in Table 5.<br />
Table 5: NCDENR Macroinvertebrate Sample Results<br />
Site Stream County Road Bioclassification<br />
SSB-3 <strong>Goose</strong> <strong>Creek</strong> Mecklenburg SR 1004 Good<br />
SSB-4 <strong>Goose</strong> <strong>Creek</strong> Union Glamorgan Rd. Good<br />
SSB-5 <strong>Goose</strong> <strong>Creek</strong> Union SR 1524 Good<br />
SSB-6 <strong>Goose</strong> <strong>Creek</strong> Union Below Fairfield Fair<br />
SSB-7 <strong>Goose</strong> <strong>Creek</strong> Union SR 1525 Poor<br />
SSB-8 <strong>Goose</strong> <strong>Creek</strong> Union SR 1533 Fair<br />
B-5 <strong>Goose</strong> <strong>Creek</strong> Union US 601 Poor<br />
SSB-9 <strong>Goose</strong> <strong>Creek</strong> Union SR 1547 Fair<br />
SSB-1 Stevens <strong>Creek</strong> Mecklenburg Maple Hollow Rd. Good<br />
SSB-2 Stevens <strong>Creek</strong> Mecklenburg Thompson Rd Not Impaired<br />
SSB-10 Duck <strong>Creek</strong> Union US 601 Fair<br />
The distribution of the population with the watershed is currently unknown; however it is<br />
likely that no supporting populations of the mussel are in Mecklenburg County because<br />
July<br />
2003<br />
11<br />
June<br />
2004<br />
July<br />
2005<br />
July<br />
2006<br />
July<br />
2007<br />
Fully Supporting<br />
Partially Supporting<br />
Not Supporting
<strong>Goose</strong> <strong>Creek</strong> <strong>Watershed</strong> <strong>Management</strong> <strong>Plan</strong> <strong>Version</strong> 1...………………...October 31, 2009<br />
of the high likelihood of <strong>Goose</strong> <strong>Creek</strong> going dry within the County. Specific information<br />
about the Carolina Heelsplitter can be found at the following website:<br />
http://www.natureserve.org/explorer/servlet/NatureServe?searchName=Lasmigona+deco<br />
rata<br />
2.2.4 Stream Flow<br />
A watershed will generate larger volumes of storm water runoff and discharge this runoff<br />
at higher rates as the amount of imperviousness increases as a result of development. The<br />
stream channels that receive the additional runoff are exposed to increased hydraulic<br />
forces that can lead to morphologic instabilities through erosion – a process that reduces<br />
the availability and quality of aquatic habitat. Aquatic species are dependent upon the<br />
channel boundary for shelter, foraging, reproduction, and rest. When boundary materials<br />
regularly erode, the aquatic habitat is impacted and unlikely to support a diverse, healthy<br />
aquatic community. Therefore, addressing the source of the habitat degradation,<br />
additional storm water runoff in this case, will help reduce impairment to in-stream<br />
biological communities (Tetra Tech, 2004)<br />
2.2.5 Land Use/Land Cover<br />
The land-use/land-cover data set used for this <strong>Watershed</strong> <strong>Management</strong> <strong>Plan</strong> was<br />
developed by Tetra Tech Inc. (2004) for the Post Construction Ordinance development<br />
process. The data set was developed through interpretation of a combination of parcel<br />
information, aerial photographs, and tree canopy data. The process is more thoroughly<br />
described in Tetra Tech Inc. (2004). The land-use data set provides a distribution and<br />
classification of all land-uses in the <strong>Goose</strong> <strong>Creek</strong> <strong>Watershed</strong>. The land-use categories<br />
represented in the <strong>Goose</strong> <strong>Creek</strong> <strong>Watershed</strong> are presented in Table 6 and the distribution<br />
of the land-uses for the <strong>Goose</strong> <strong>Creek</strong> <strong>Watershed</strong> is shown in Figure 8.<br />
12
<strong>Goose</strong> <strong>Creek</strong> <strong>Watershed</strong> <strong>Management</strong> <strong>Plan</strong> <strong>Version</strong> 1...………………...October 31, 2009<br />
Table 6: <strong>Goose</strong> <strong>Creek</strong> Land Use Categories.<br />
Land Use Class Abbreviation<br />
Agriculture AG<br />
Heavy Commercial COMM-H<br />
Light Commercial COMM-L<br />
Forest FRST<br />
Golf Course GC<br />
High Density Residential HDR<br />
High Density Multifamily Residential HMFR<br />
High Density Mixed Urban HMX<br />
Heavy Industrial IND<br />
Institutional INS<br />
Interstate Corridor INTERSTATE<br />
Low Density Residential LDR<br />
Medium Density Residential MDR<br />
Meadow MEADOW<br />
Multi Family Residential MFR<br />
Medium Low Density Residential MLDR<br />
Mixed Urban MX<br />
Office/Industrial OI-H<br />
Light Office/Light Industrial OI-L<br />
Park PARK<br />
Rural Residential RR<br />
Ultra High Density Mixed Urban UHMX<br />
13
<strong>Goose</strong> <strong>Creek</strong> <strong>Watershed</strong> <strong>Management</strong> <strong>Plan</strong> <strong>Version</strong> 1...………………...October 31, 2009<br />
Figure 8: Distribution of Land Uses in the <strong>Goose</strong> <strong>Creek</strong> <strong>Watershed</strong>.<br />
2.2.6 Soils<br />
The distribution of soils within the <strong>Goose</strong> <strong>Creek</strong> <strong>Watershed</strong> was determined through the<br />
Soil Survey of Mecklenburg County (USDOA – SCS, 1980). The hydrologic soil types<br />
found in the <strong>Goose</strong> <strong>Creek</strong> <strong>Watershed</strong> are B and C. A description of each soil type and<br />
distribution within the watershed are shown in Table 7. Figure 9 shows the location of<br />
the hydrologic soil groups in the <strong>Goose</strong> <strong>Creek</strong> <strong>Watershed</strong>.<br />
Table 7: Hydrologic Soil Groups Found Within the <strong>Goose</strong> <strong>Creek</strong> <strong>Watershed</strong>.<br />
Hydrologic<br />
Soil Group<br />
MATTHEWS-MINT HILL<br />
DAVID<br />
FOUR OAKS<br />
WELL<br />
IDLEFIELD<br />
MINTWOOD<br />
HOODRIDGE<br />
PEGGY<br />
PIAFFE<br />
BEECH MINT<br />
DAVIS TRACE<br />
BLACKJACK<br />
CRESTHILL<br />
LAWYERS<br />
THOMPSON<br />
YARMOUTH<br />
BAIN SCHOOL<br />
JOLI CHEVAL<br />
MCWHIRTER<br />
FOX HOLLOW<br />
Description (USDOA –SCS, 1980) Distribution with<br />
<strong>Goose</strong> <strong>Creek</strong><br />
B Soils having a moderate infiltration rate when thoroughly wet.<br />
These consist chiefly of moderately deep or deep, moderately<br />
well drained or well drained soils that have moderately fine<br />
texture to moderately coarse texture. These soils have a<br />
JUMPER<br />
moderate rate of water transmission<br />
C Soils having a slow infiltration rate when thoroughly wet.<br />
These consist chiefly of soils that have a layer that impedes the<br />
downward movement of water of soils that have moderately fine<br />
texture or fine texture. These soils have a slow rate of water<br />
transmission.<br />
RANBURNE<br />
KIDWELLY<br />
FAIRVIEW<br />
QUAIL PARK<br />
SILAS ED<br />
I-485<br />
I-485<br />
I-485 INNER<br />
I-485 OUTER<br />
I-485<br />
ALLEN BLACK<br />
14<br />
BRIEF<br />
WHITMIRE<br />
ALEXIS<br />
LONG<br />
FIELDLARK<br />
BRIEF<br />
UNION<br />
BRIEF<br />
FAIRVIEW<br />
PERSIMMON CREEK<br />
BRIEF<br />
HANGING MOSS<br />
BRIEF<br />
QUARTERS<br />
Legend<br />
BRIEF<br />
TARA OAKS<br />
INDIAN TRAIL<br />
existing-landuse-by-catchment<br />
EXISTING LU<br />
GC<br />
TRANS<br />
COMM-H<br />
COMM-L<br />
FRST<br />
GC<br />
HDR<br />
INS<br />
LDR<br />
MDR<br />
MFR<br />
MLDR<br />
OI-H<br />
OI-L<br />
RR<br />
TRANS<br />
VCNT<br />
BRIEF<br />
<strong>Watershed</strong><br />
6314 Acres (88% of<br />
watershed)<br />
856 acres (12% of<br />
watershed)
<strong>Goose</strong> <strong>Creek</strong> <strong>Watershed</strong> <strong>Management</strong> <strong>Plan</strong> <strong>Version</strong> 1...………………...October 31, 2009<br />
Figure 9: Distribution of Hydrologic Soil Groups in the <strong>Goose</strong> <strong>Creek</strong> <strong>Watershed</strong>.<br />
2.3 Current <strong>Watershed</strong> Protection Efforts<br />
2.3.1 S.W.I.M. Buffer Ordinance<br />
A countywide stream buffer system was established in 1999 as part of the Surface Water<br />
Improvement and <strong>Management</strong> (S.W.I.M.) strategy, otherwise known as S.W.I.M.<br />
buffers. According to S.W.I.M., streams have the primary natural function of conveying<br />
storm and ground water, storing floodwaters and supporting aquatic and other wildlife.<br />
The buffer is the vegetated land adjacent to the stream channel, which functions to<br />
protect water quality by filtering pollutants and to provide both storage for floodwaters<br />
and suitable habitat for wildlife. The ordinance was in effect until Mint Hill’s Post<br />
Construction ordinance took effect on June 30, 2007. However, property developed<br />
under the S.W.I.M. buffer ordinance will remain subject to it.<br />
Required stream buffer widths vary from 35 to 100 feet or the entire 100 year floodplain,<br />
whichever is greater, based on the size of the upstream drainage basin. In Mint Hill,<br />
S.W.I.M. buffer requirements begin at a point where the stream drains 50 acres. Table 8<br />
presents the S.W.I.M. buffer requirements for Mint Hill. Figure 10 shows the extent of<br />
the S.W.I.M. buffers in the <strong>Goose</strong> <strong>Creek</strong> <strong>Watershed</strong>.<br />
15<br />
Legend<br />
goose-soils<br />
HYDRIC<br />
<br />
0 1,900 3,800 7,600 11,400 15,200<br />
Feet<br />
B<br />
C
<strong>Goose</strong> <strong>Creek</strong> <strong>Watershed</strong> <strong>Management</strong> <strong>Plan</strong> <strong>Version</strong> 1...………………...October 31, 2009<br />
Table 8: S.W.I.M. Buffer Requirements for the <strong>Goose</strong> <strong>Creek</strong> <strong>Watershed</strong>.<br />
Jurisdiction<br />
Mint Hill<br />
Date<br />
Ordinance<br />
Adopted<br />
October,<br />
1999<br />
16<br />
Total Buffer Widths<br />
> 640 acres > 300 acres > 50 acres<br />
total = floodway +<br />
100% of floodfringe<br />
but no less than 100 ft<br />
streamside = 30ft<br />
managed use = 45 ft<br />
upland = remainder<br />
total = 50 feet<br />
streamside = 20ft<br />
managed use = 20ft.<br />
upland = 10ft<br />
total = 35 ft<br />
streamside = 20ft<br />
managed = none<br />
upland = 15ft<br />
All buffers are measure horizontally on a line perpendicular to the surface water, landward from<br />
the top of the bank on each side of the stream.<br />
Figure10: Approximate Extent of the <strong>Goose</strong> <strong>Creek</strong> <strong>Watershed</strong> S.W.I.M. Buffers.<br />
2.3.2 Post Construction Buffers<br />
On June 30, 2007, Mint Hill implemented the Post Construction Ordinance that required<br />
100-foot buffers on all dashed streams on USGS topographic maps and 200-foot buffers<br />
on all solid streams on USGS topographic maps. The Post Construction Ordinance was<br />
replaced by the Site Specific <strong>Management</strong> <strong>Plan</strong> (developed by NCDENR) for the <strong>Goose</strong>
<strong>Goose</strong> <strong>Creek</strong> <strong>Watershed</strong> <strong>Management</strong> <strong>Plan</strong> <strong>Version</strong> 1...………………...October 31, 2009<br />
<strong>Creek</strong> <strong>Watershed</strong> on February 1, 2009. Both ordinances apply but the more stringent<br />
requirement must be met. Properties developed from June 30, 2007 through February 1,<br />
2009 are required to conform to the Post Construction Buffers. Figure 11 shows the<br />
approximate extent of the <strong>Goose</strong> <strong>Creek</strong> <strong>Watershed</strong> Post Construction Buffers.<br />
Figure 11: Approximate Extent of the <strong>Goose</strong> <strong>Creek</strong> <strong>Watershed</strong> Post Construction<br />
Buffers.<br />
2.3.3 <strong>Goose</strong> <strong>Creek</strong> <strong>Watershed</strong> Site Specific <strong>Management</strong> <strong>Plan</strong>.<br />
The <strong>Goose</strong> <strong>Creek</strong> Site Specific <strong>Management</strong> <strong>Plan</strong> was adopted on February 1, 2009 and<br />
applies to the entire <strong>Goose</strong> <strong>Creek</strong> <strong>Watershed</strong>. The expressed purpose of the ordinance is<br />
to protect the endangered Carolina Heelsplitter Mussel. The ordinance places specific<br />
controls on all new development in the watershed including the following:<br />
1. Controls stormwater for all projects disturbing more than one acre. These<br />
requirements include the removal of 85% TSS and control and release of the 1 year<br />
24 hour storm at pre-development rates.<br />
2. Controls discharges from WWTPs. No new WWTP discharges will be permitted.<br />
3. Controls toxicity to streams for specific parameters. Ammonia is to be reduced to 0.5<br />
mg/L from all discharges to <strong>Goose</strong> <strong>Creek</strong>.<br />
4. Maintains riparian buffers. All waterbodies within the 100-Year Floodplain will have<br />
17
<strong>Goose</strong> <strong>Creek</strong> <strong>Watershed</strong> <strong>Management</strong> <strong>Plan</strong> <strong>Version</strong> 1...………………...October 31, 2009<br />
a 200 foot buffer, other waterbodies will have a 100 foot buffer. These buffers are<br />
essentially the same as the Post Construction Buffers.<br />
For the purpose of this <strong>Watershed</strong> <strong>Management</strong> <strong>Plan</strong>, it is assumed that the Site Specific<br />
<strong>Management</strong> <strong>Plan</strong> for the <strong>Goose</strong> <strong>Creek</strong> <strong>Watershed</strong> will mitigate future impacts to water<br />
quality from new development. For this reason, the remainder of the <strong>Plan</strong> and the<br />
recommendations listed are focused upon reducing pollution sources from existing<br />
development where limited or no water quality mitigation efforts have been required.<br />
2.3.4 BMP Retrofits and Land Acquisition<br />
Public property in the <strong>Goose</strong> <strong>Creek</strong> <strong>Watershed</strong> is limited. Figure 12 shows the<br />
distribution of these properties.<br />
MATTHEWS-MINT HILL<br />
DAVID<br />
FOUR OAKS<br />
WELL<br />
LAWYERS<br />
THOMPSON<br />
Figure 12: Public Property in the <strong>Goose</strong> <strong>Creek</strong> <strong>Watershed</strong>.<br />
<strong>Goose</strong> <strong>Creek</strong> Raingarden Project<br />
IDLEFIELD<br />
MINTWOOD<br />
HOODRIDGE<br />
PEGGY<br />
PIAFFE<br />
BEECH MINT<br />
DAVIS TRACE<br />
BLACKJACK<br />
CRESTHILL<br />
YARMOUTH<br />
BAIN SCHOOL<br />
JOLI CHEVAL<br />
MCWHIRTER<br />
FOX HOLLOW<br />
JUMPER<br />
RANBURNE<br />
KIDWELLY<br />
FAIRVIEW<br />
QUAIL PARK<br />
SILAS ED<br />
I-485<br />
I-485<br />
I-485 INNER<br />
I-485 OUTER<br />
A grant was obtained by CMSWS with the goal of reducing the discharge of non-point<br />
source pollutants from land development activities and improving water quality<br />
conditions in <strong>Goose</strong> <strong>Creek</strong>. Specifically, the grant seeks to protect habitat for the<br />
Carolina heelsplitter through the completion of retrofitting LID structures into existing<br />
I-485<br />
ALLEN BLACK<br />
18<br />
BRIEF<br />
WHITMIRE<br />
ALEXIS<br />
LONG<br />
FIELDLARK<br />
BRIEF<br />
UNION<br />
BRIEF<br />
FAIRVIEW<br />
PERSIMMON CREEK<br />
Legend<br />
BRIEF<br />
HANGING MOSS<br />
BRIEF<br />
QUARTERS<br />
goose-public-parcels<br />
BRIEF<br />
TARA OAKS<br />
INDIAN TRAIL<br />
BRIEF
<strong>Goose</strong> <strong>Creek</strong> <strong>Watershed</strong> <strong>Management</strong> <strong>Plan</strong> <strong>Version</strong> 1...………………...October 31, 2009<br />
developments within the <strong>Goose</strong> <strong>Creek</strong> watershed in Mint Hill. These structures also<br />
serve as demonstration projects for the use of LID techniques. Educational signage was<br />
incorporated into the demonstration projects to promote the proper implementation of<br />
LID.<br />
The first of the project sites is located at the Mint Hill Park on Fairview Road. The 52acre<br />
park located in the headwaters of the <strong>Goose</strong> <strong>Creek</strong> watershed has approximately 3<br />
acres of impervious surface, including a large parking area. It has soccer and baseball<br />
fields, tennis and handball courts, a playground, and nature trails. Prior to the project, a<br />
curb and gutter system conveyed storm water from parking lots, trails and outbuildings to<br />
a detention basin before discharging into <strong>Goose</strong> <strong>Creek</strong>. The project re-routed storm water<br />
from 4.9 acres through LID BMPs. The other LID demonstration project is located at the<br />
Bain Elementary School in the <strong>Goose</strong> <strong>Creek</strong> watershed within the Town of Mint Hill.<br />
This project treated previously untreated runoff from approximately 1 acre of parking lot<br />
with a raingarden.<br />
2.3.5 Existing NPDES Permitted WWTPs<br />
At the time of writing of the <strong>Goose</strong> <strong>Creek</strong> Fecal Coliform TMDL there were six<br />
permitted WWTPs. Since that time the Hunley <strong>Creek</strong> and Fairview Elementary facilities<br />
have been taken off line. Table 9 presents the remaining permitted dischargers.<br />
Table 9: NPDES Permitted Dischargers in the <strong>Goose</strong> <strong>Creek</strong> <strong>Watershed</strong><br />
Facility Name Address NPDES ID Permitted Flow<br />
(cfs)<br />
Oxford Glen 15349 Bexley Place NC0063584 0.075<br />
Ashe <strong>Plan</strong>tation Quarters Lane NC0065749 0.154<br />
Country Woods Country Woods Dr NC0065684 1.036<br />
Fairfield <strong>Plan</strong>tation Stoney Ridge Rd NC0034762 0.108<br />
19
<strong>Goose</strong> <strong>Creek</strong> <strong>Watershed</strong> <strong>Management</strong> <strong>Plan</strong> <strong>Version</strong> 1...………………...October 31, 2009<br />
SECTION 3. WATERSHED INDICATORS AND GOALS<br />
3.1 Upland<br />
3.1.1 Upland Water Quality Indicators<br />
Upland water quality is associated with pollutants in storm water runoff from the<br />
watershed draining to <strong>Goose</strong> <strong>Creek</strong>. The upland water quality indicators selected for this<br />
<strong>Watershed</strong> <strong>Management</strong> <strong>Plan</strong> are Total Suspended Sediment (TSS), Total Phosphorus<br />
(TP) and Total Nitrogen (TN). These pollutants are indicative of the impact that<br />
contaminated storm water runoff has on water quality. Moreover, they are capable of<br />
being accurately simulated with relatively simple methods (unlike temperature or fecal<br />
coliform) and are indicators of other parameters of concern.<br />
3.1.2 Upland Water Quality Goals<br />
Tetra Tech (2004) conducted an analysis of watershed scale upland loading rates for<br />
existing conditions for all watersheds in Mecklenburg County for TSS, TN and TP. They<br />
correlated the loading rates back to biological health and scored each watershed based<br />
upon the results. They were able to determine that watersheds capable of sustaining a<br />
fully supporting biological community displayed very similar upland pollutant loading<br />
rates for TSS, TN and TP. Similarly, the <strong>Goose</strong> <strong>Creek</strong> Fecal Coliform TMDL (MCWQP<br />
and NCDENR, 2005) presented a necessary reduction in upland fecal coliform of 92.5%<br />
to attain the in-stream standard. Upland fecal coliform reductions of 92.5% are<br />
essentially unattainable using currently available technology and techniques. Treatment<br />
for fecal coliform will be optimized to the maximum extent practicable using existing<br />
technology and techniques and working with site specific constraints. The upland goals<br />
for ammonia and copper were developed through the estimated loading rates from the<br />
rural residential land uses. The upland loading rate goals and percent reductions are<br />
presented in Table 10.<br />
Table 10: Upland Pollutant Loading Rate Goals.<br />
Upland Pollutant Loading Rate Goals<br />
1. TN < 4 lbs/ac/year<br />
2. Ammonia < 0.2 lbs/ac/year and End of Pipe concentrations < 0.5 mg/lt<br />
3. TP < 0.6 lbs/ac/year<br />
4. TSS < 0.22 tons/ac/year<br />
5. Fecal Coliform: 92.5% reduction in upland fecal coliform.<br />
6. Copper < 0.01 lbs/ac/year<br />
In addition to the loading rate goals, a specific concentration goal for ammonia of 0.5<br />
mg/L has been adopted for new development. It is estimated that attaining the TN goal<br />
listed in Table 10 for existing development will result in attainment of the 0.5 mg/L goal<br />
listed in the Site Specific <strong>Management</strong> <strong>Plan</strong> as well. The TN goal of < 4 lbs/ac/year<br />
equates to a loading rate of a forested tract. Forested tracts have proven to be the most<br />
sustainable land-cover for the Carolina Heelsplitter, indicating this goal will be effective.<br />
20
<strong>Goose</strong> <strong>Creek</strong> <strong>Watershed</strong> <strong>Management</strong> <strong>Plan</strong> <strong>Version</strong> 1...………………...October 31, 2009<br />
Similarly, a 92.5% reduction in fecal coliform bacteria in the watershed was established<br />
in the TMDL. To attain this goal, all stormwater originating from built upon areas will<br />
need to be treated using either a bioretention cell or infiltration trench. These BMPs are<br />
the only ones capable of removing 90% of fecal coliform from stormwater runoff.<br />
The goals presented in Table 10 are appropriate to be applied to retrofit BMP projects as<br />
a catchment wide design standard. In other words, retrofit BMP projects in a particular<br />
catchment should strive to meet the goals in Table 10; however, it is recognized that each<br />
individual project may not meet the goals.<br />
3.2 In-Stream<br />
3.2.1 In-Stream Water Quality Indicators<br />
In-stream water quality is associated with pollutants in the stream channel. The in-stream<br />
water quality indicator selected for this <strong>Watershed</strong> <strong>Management</strong> <strong>Plan</strong> is TSS. This<br />
indicator will provide an indication of the TSS pollutant load conveyed by the channel.<br />
3.2.2 In-Stream Water Quality Goals<br />
Tetra Tech, Inc. (2002) summarized several reports pertaining to sediment production<br />
and biological health. Simmons (1993) summarized sediment characteristics of 152<br />
North Carolina streams and rivers (including 100 within the Piedmont region) from data<br />
taken during the 1970s. Crawford and Lenat (1989) provide estimates of annual sediment<br />
yield from three (3) Piedmont watersheds near Raleigh, N.C., including 0.13 ton/acre for<br />
a predominantly forested watershed, 0.31 ton/acre from an agricultural watershed, and<br />
0.59 ton/acre from an urban watershed. In both studies, sediment yield was estimated<br />
from in-stream suspended sediment concentrations, so the annual areal sediment yields<br />
reflect not only sediment from the land surface but also in-stream sediment transport and<br />
sediment from bank erosion/collapse. Crawford and Lenat (1989) performed extensive<br />
biological sampling in the three watersheds they studied and calculated metrics for taxa<br />
richness, abundance, and pollution tolerance for invertebrates and fish. In summarizing<br />
their biological data, they rated the forested watershed as having high measures of biotic<br />
characteristics, the agricultural watershed as having medium to high measures, and the<br />
urban watershed as having low measures. Under North Carolina water quality<br />
regulations, streams and lakes must be able to support aquatic life. A rating of Fair or<br />
Poor for Benthic Invertebrate Bioclassification or Fish Community Structure prevents a<br />
water body from being rated as “fully supporting” under Section 305(b) of the Clean<br />
Water Act. Based on the two studies investigated by Tetra Tech, Inc., an approximate instream<br />
sediment load goal of 0.30 ton/acre/year is recommended as a goal.<br />
Currently, in-stream data allowing assessment of the sediment load goal of 0.30<br />
tons/acre/year is not available in the <strong>Goose</strong> <strong>Creek</strong> <strong>Watershed</strong>. In order to determine<br />
progress toward the goal, it is proposed that two (2) long term sediment monitoring<br />
stations be installed in the <strong>Goose</strong> <strong>Creek</strong> <strong>Watershed</strong>. These sites should coincide with<br />
long term monitoring sites established for assessing channel properties (permanent cross<br />
21
<strong>Goose</strong> <strong>Creek</strong> <strong>Watershed</strong> <strong>Management</strong> <strong>Plan</strong> <strong>Version</strong> 1...………………...October 31, 2009<br />
sections, etc.). One site should be established on Duck <strong>Creek</strong> near Tara Oaks and the<br />
other site should be established upstream of The Bridges Mall Site. Data collected at<br />
these sites will allow the development of an annual sediment versus time flow curve.<br />
Each year will be compared against previous years to determine if the sediment carrying<br />
characteristics of <strong>Goose</strong> <strong>Creek</strong> (and hence the sediment loads) are improving. Also, the<br />
data collected will be used to estimate progress toward attaining the overall goal of 0.30<br />
tons/acre/year. Table 11 presents the in-stream water quality goals.<br />
Table 11: In-Stream Water Quality Goals.<br />
In-Stream Water Quality Goals<br />
1. TSS < 0.3 tons/ac/year<br />
2. Benthic Macroinvertebrates = Fully Supporting<br />
3. Fish = Fully Supporting<br />
4. Attainment of fecal coliform standard (200 c.f.u./100 ml)<br />
5. Attainment of ammonia end of pipe goal of 0.5 mg/L<br />
Monitoring to determine compliance with these goals is presented in Appendix A.<br />
22
<strong>Goose</strong> <strong>Creek</strong> <strong>Watershed</strong> <strong>Management</strong> <strong>Plan</strong> <strong>Version</strong> 1...………………...October 31, 2009<br />
SECTION 4. WATERSHED ASSESSMENT<br />
4.1 Upland Characterization<br />
In order to prioritize areas of the <strong>Goose</strong> <strong>Creek</strong> <strong>Watershed</strong>, an upland characterization<br />
methodology was developed based upon work completed by Tetra Tech, Inc. (2004) for<br />
the Post Construction Ordinance Stakeholder Group. The resulting prioritization will be<br />
used to guide property acquisition for installation of water quality BMPs and to focus<br />
efforts on voluntary retrofitting of existing upland sources of pollution.<br />
The upland characterization was completed through an evaluation of existing levels of<br />
pollutant loading, impervious cover and buffer impacts. Specifically, the indicators used<br />
were Total Phosphorus (TP), Total Nitrogen (TN), Total Suspended Sediment (TSS),<br />
Fecal Coliform, ammonia, Copper and percent of the stream buffer currently un-forested.<br />
The information presented in this Section of the <strong>Watershed</strong> <strong>Management</strong> <strong>Plan</strong> deals only<br />
with existing sources of pollution in the <strong>Goose</strong> <strong>Creek</strong> <strong>Watershed</strong>. For the purpose of this<br />
document, it was assumed that future sources of pollution will be attenuated through<br />
implementation of the Site Specific <strong>Management</strong> <strong>Plan</strong>, which is presented in Section<br />
2.3.3.<br />
4.1.1 Methodology<br />
The basis for the upland characterization presented herein is an updated existing land-use<br />
dataset developed by Tetra Tech Inc. (2004). The land-use data set was developed<br />
through interpretation of a combination of parcel information, aerial photographs, and<br />
tree canopy data. The process is more thoroughly described in Tetra Tech Inc. (2004).<br />
Development in the watershed that has occurred since 2004 was manually entered into<br />
the data set. The land-use data set provides a distribution and classification of all landuses<br />
in the <strong>Goose</strong> <strong>Creek</strong> <strong>Watershed</strong>. The land-use categories, along with abbreviations<br />
and typical impervious percentages seen in the <strong>Goose</strong> <strong>Creek</strong> watershed are presented in<br />
Table 12.<br />
23
<strong>Goose</strong> <strong>Creek</strong> <strong>Watershed</strong> <strong>Management</strong> <strong>Plan</strong> <strong>Version</strong> 1...………………...October 31, 2009<br />
Table 12: <strong>Goose</strong> <strong>Creek</strong> Land Use Categories and Abbreviations.<br />
Land Use Class<br />
Typical Lot<br />
Size<br />
Percent<br />
Impervious Abbreviation<br />
Heavy Commercial Variable 85 COMM-H<br />
Light Commercial Variable 45 COMM-L<br />
Forest NA 0 FRST<br />
Golf Course NA 8 GC<br />
High Density Residential 0.125 – 0.25 ac 41 HDR<br />
High Density Multifamily Residential Variable 70 HMFR<br />
High Density Mixed Urban Variable 70 HMX<br />
Heavy Industrial Variable 66 IND<br />
Institutional Variable 40 INS<br />
Interstate Corridor NA 36 INTERSTATE<br />
Low Density Residential 2 – 5 ac 9 LDR<br />
Medium Density Residential 0.25 – 0.5 ac 30 MDR<br />
Meadow NA 0 MEADOW<br />
Multi Family Residential 5 ac 4 RR<br />
Ultra High Density Mixed Urban Variable 90 UHMX<br />
The distribution of the land-uses for the <strong>Goose</strong> <strong>Creek</strong> watershed is shown in Figure 8.<br />
The land-use data for the <strong>Goose</strong> <strong>Creek</strong> <strong>Watershed</strong> was sub-divided into catchments using<br />
GIS software. The catchments were delineated using the <strong>Watershed</strong> Information System<br />
(WISe) with an approximate drainage area of 1 square mile per catchment. Catchments<br />
with very small drainage areas were merged into nearby catchments to reduce the number<br />
of reporting units. A total of 14 catchments were delineated for the <strong>Goose</strong> <strong>Creek</strong><br />
<strong>Watershed</strong>. Figure 13 shows the distribution of the catchments in the <strong>Goose</strong> <strong>Creek</strong><br />
<strong>Watershed</strong>.<br />
24
<strong>Goose</strong> <strong>Creek</strong> <strong>Watershed</strong> <strong>Management</strong> <strong>Plan</strong> <strong>Version</strong> 1...………………...October 31, 2009<br />
BASIN6<br />
BASIN8<br />
BASIN3<br />
BASIN10<br />
BASIN4<br />
BASIN13<br />
BASIN2<br />
BASIN1<br />
BASIN5<br />
BASIN11<br />
BASIN9<br />
Figure 13: <strong>Goose</strong> <strong>Creek</strong> <strong>Watershed</strong> Catchments.<br />
The upland pollutant loading rates by land-use for TP, TN and TSS were adopted from<br />
Tetra Tech Inc. (2004) and are listed in Table 13. Loading rates for ammonia and fecal<br />
coliform were calculated using annual runoff estimates and concentrations within the Site<br />
Evaluation Tool (Tetra Tech, Inc., 2005). Catchment loading rates were determined by<br />
multiplying the area of each land-use in the catchment by the appropriate loading rate and<br />
summing the total for all land-uses within the catchment. Catchment scale loading rates<br />
for the <strong>Goose</strong> <strong>Creek</strong> Basins are provided in Table 14.<br />
25<br />
BASIN12<br />
BASIN14<br />
BASIN7<br />
0 3,800 7,600 11,400 15,200<br />
1,900<br />
Feet
<strong>Goose</strong> <strong>Creek</strong> <strong>Watershed</strong> <strong>Management</strong> <strong>Plan</strong> <strong>Version</strong> 1...………………...October 31, 2009<br />
Table 13: Upland Pollutant Loading Rates by Land-Use.<br />
LAND-USE<br />
TN<br />
(lbs/ac/year)<br />
TP<br />
(lbs/ac/year)<br />
TSS<br />
(tons/ac/year)<br />
26<br />
Ammonia<br />
(lbs/ac/year)<br />
Fecal<br />
Coliform<br />
(c.f.u./year<br />
x 10 10 )<br />
Copper<br />
(lbs/ac/year)<br />
COMM-H 19.44 2.85 0.76 4.38 38 0.124<br />
COMM-L 12.44 1.88 0.69 2.05 20 0.070<br />
GC 5.17 0.83 0.47 0.22 4 0.012<br />
HDR 8.73 1.4 0.47 1.14 18 0.064<br />
INS 8.63 1.39 0.48 1.15 18 0.063<br />
INTERSTATE 7.81 1.25 0.4 3.65 16 0.118<br />
LDR 4.1 0.66 0.28 0.39 4 0.016<br />
MDR 7.61 1.24 0.52 0.87 13 0.035<br />
MEADOW 2.39 0.38 0.13 0.11 0.3 0.006<br />
MFR 10.65 1.68 0.39 2.65 27 0.090<br />
MLDR 6.5 1.07 0.57 0.61 9 0.024<br />
OI-H 11.87 1.86 0.34 1.94 32 0.106<br />
OI-L 7.61 1.24 0.52 0.90 13 0.035<br />
RR 3.59 0.59 0.3 0.16 2 0.009<br />
Note: See Table 12 for abbreviation descriptions.<br />
Table 14: Catchment Loading Rates<br />
Basin ID Fecal<br />
Coliform<br />
(cfu/year)<br />
TN<br />
(lbs/year)<br />
TP<br />
(lbs/year)<br />
TSS<br />
(tons/year)<br />
Ammonia<br />
(lbs/year)<br />
Copper<br />
(lbs/year)<br />
BASIN1 3.0E+13 2762 444 191 405 15.4<br />
BASIN2 8.6E+12 663 107 46 122 4.5<br />
BASIN3 3.1E+13 3030 490 216 374 14.5<br />
BASIN4 4.6E+13 3637 585 252 468 18.3<br />
BASIN5 1.7E+13 1250 201 80 308 10.6<br />
BASIN6 3.8E+13 3194 513 221 426 16.3<br />
BASIN7 7.6E+12 1055 170 77 92 3.9<br />
BASIN8 3.1E+13 2974 481 215 338 13.5<br />
BASIN9 1.1E+13 1338 216 98 128 5.4<br />
BASIN10 6.1E+12 783 126 58 75 3.1<br />
BASIN11 3.9E+13 2952 459 168 573 18.9<br />
BASIN12 4.5E+13 4723 763 346 503 20.3<br />
BASIN13 5.8E+12 713 114 46 106 4.0<br />
BASIN14 1.6E+13 1718 279 134 166 6.8<br />
The percent of impacted buffer in the <strong>Goose</strong> <strong>Creek</strong> <strong>Watershed</strong> was also characterized.<br />
The characterization was completed using tree canopy data for Mecklenburg County<br />
intersected with the FEMA floodplain delineation and the S.W.I.M. and <strong>Watershed</strong> buffer<br />
coverages. The resulting GIS dataset, which depicts the presence or absence of tree<br />
canopy within stream buffers, was intersected with the catchment coverage to determine<br />
the percent of un-forested buffer within each catchment. Figure 14 shows the distribution<br />
of forested and un-forested buffer within the <strong>Goose</strong> <strong>Creek</strong> <strong>Watershed</strong>.
<strong>Goose</strong> <strong>Creek</strong> <strong>Watershed</strong> <strong>Management</strong> <strong>Plan</strong> <strong>Version</strong> 1...………………...October 31, 2009<br />
Figure 14: Distribution of Forested and Un-forested Stream Buffers within the<br />
<strong>Goose</strong> <strong>Creek</strong> <strong>Watershed</strong>.<br />
Levels of impervious area, which are indicative of level of development, for the <strong>Goose</strong><br />
<strong>Creek</strong> <strong>Watershed</strong> were characterized by catchment. Impervious percentages by<br />
catchment were determined by multiplying the area of each land-use within the<br />
catchment by the appropriate impervious percentage (Table 12) and summing the<br />
resulting impervious areas for the entire catchment. Catchment area, impervious area and<br />
impervious percentage information is presented in Table 15.<br />
Table 15: Catchment Area, Impervious Area and Impervious Percentages<br />
Total Area Impervious Impervious<br />
Basin ID (ac) Area (ac) Percentage<br />
BASIN1 637.5 70.2 11%<br />
BASIN2 127.9 20.0 16%<br />
BASIN3 726.0 76.6 11%<br />
BASIN4 713.5 106.6 15%<br />
BASIN5 254.9 40.3 16%<br />
BASIN6 681.7 85.8 13%<br />
BASIN7 297.5 19.3 6%<br />
BASIN8 694.0 73.1 11%<br />
BASIN9 341.2 29.3 9%<br />
BASIN10 210.7 15.6 7%<br />
BASIN11 523.6 92.8 18%<br />
BASIN12 1137.9 111.2 10%<br />
BASIN13 201.8 16.9 8%<br />
BASIN14 403.6 36.4 9%<br />
27<br />
Legend<br />
Forested Buffer<br />
Unforested Buffer<br />
catchments<br />
0 1,900 3,800 7,600 11,400 15,200<br />
Feet
<strong>Goose</strong> <strong>Creek</strong> <strong>Watershed</strong> <strong>Management</strong> <strong>Plan</strong> <strong>Version</strong> 1...………………...October 31, 2009<br />
4.1.2 Results<br />
Results for each of the basins for each indicator evaluated were ranked to determine the<br />
basins with the highest level of impairment. Table 16 presents the ranks for all 14 <strong>Goose</strong><br />
<strong>Creek</strong> Basins.<br />
Table 16: Results of Upland Impairment Characterization. Note: Higher rank<br />
indicates increasing level of impairment (Basin 11 most impaired).<br />
Fecal TN TP TSS NH4 Cu Average Overall<br />
Basin ID Rank Rank Rank Rank Rank Rank Rank Rank<br />
BASIN11 1 1 1 5 2 2 2 1<br />
BASIN2 2 2 2 1 3 3 2 2<br />
BASIN5 3 4 4 6 1 1 3 3<br />
BASIN4 4 3 3 2 4 4 3 4<br />
BASIN6 5 5 5 4 6 6 5 5<br />
BASIN1 6 6 6 9 5 5 6 6<br />
BASIN8 7 7 7 7 9 9 8 7<br />
BASIN14 9 8 8 3 11 11 8 8<br />
BASIN3 8 9 9 10 8 7 9 9<br />
BASIN12 10 10 10 8 10 10 10 10<br />
BASIN9 11 11 11 11 12 12 11 11<br />
BASIN13 13 14 14 14 7 8 12 12<br />
BASIN10 12 12 12 12 13 13 12 13<br />
BASIN7 14 13 13 13 14 14 14 14<br />
Figures 15 – 21 present the overall ranking based upon the results of the upland<br />
characterization for Fecal Coliform, TN, TP, TSS, NH4, Cu and Overall Impairment<br />
respectively. Note that darker colors indicate increased levels of impairment.<br />
28
<strong>Goose</strong> <strong>Creek</strong> <strong>Watershed</strong> <strong>Management</strong> <strong>Plan</strong> <strong>Version</strong> 1...………………...October 31, 2009<br />
BASIN6<br />
BASIN8<br />
BASIN3<br />
BASIN10<br />
BASIN4<br />
Figure 15: Fecal Coliform Rank.<br />
BASIN13<br />
BASIN2<br />
BASIN1<br />
BASIN5<br />
BASIN11<br />
29<br />
BASIN9<br />
BASIN12<br />
BASIN14<br />
BASIN7
<strong>Goose</strong> <strong>Creek</strong> <strong>Watershed</strong> <strong>Management</strong> <strong>Plan</strong> <strong>Version</strong> 1...………………...October 31, 2009<br />
BASIN6<br />
BASIN8<br />
Figure 16: TN Ranking.<br />
BASIN3<br />
BASIN10<br />
BASIN4<br />
BASIN13<br />
BASIN2<br />
BASIN1<br />
BASIN5<br />
BASIN11<br />
30<br />
BASIN9<br />
BASIN12<br />
BASIN14<br />
BASIN7
<strong>Goose</strong> <strong>Creek</strong> <strong>Watershed</strong> <strong>Management</strong> <strong>Plan</strong> <strong>Version</strong> 1...………………...October 31, 2009<br />
BASIN6<br />
BASIN8<br />
Figure 17: TP Ranking.<br />
BASIN3<br />
BASIN10<br />
BASIN4<br />
BASIN13<br />
BASIN2<br />
BASIN1<br />
BASIN5<br />
BASIN11<br />
31<br />
BASIN9<br />
BASIN12<br />
BASIN14<br />
BASIN7
<strong>Goose</strong> <strong>Creek</strong> <strong>Watershed</strong> <strong>Management</strong> <strong>Plan</strong> <strong>Version</strong> 1...………………...October 31, 2009<br />
BASIN6<br />
BASIN8<br />
Figure 18: TSS Ranking.<br />
BASIN3<br />
BASIN10<br />
BASIN4<br />
BASIN13<br />
BASIN2<br />
BASIN1<br />
BASIN5<br />
BASIN11<br />
32<br />
BASIN9<br />
BASIN12<br />
BASIN14<br />
BASIN7
<strong>Goose</strong> <strong>Creek</strong> <strong>Watershed</strong> <strong>Management</strong> <strong>Plan</strong> <strong>Version</strong> 1...………………...October 31, 2009<br />
BASIN6<br />
BASIN8<br />
BASIN3<br />
Figure 19: NH4 Ranking.<br />
BASIN10<br />
BASIN4<br />
BASIN13<br />
BASIN2<br />
BASIN1<br />
BASIN5<br />
BASIN11<br />
33<br />
BASIN9<br />
BASIN12<br />
BASIN14<br />
BASIN7
<strong>Goose</strong> <strong>Creek</strong> <strong>Watershed</strong> <strong>Management</strong> <strong>Plan</strong> <strong>Version</strong> 1...………………...October 31, 2009<br />
BASIN6<br />
BASIN8<br />
Figure 20: Cu Ranking.<br />
BASIN3<br />
BASIN10<br />
BASIN4<br />
BASIN13<br />
BASIN2<br />
BASIN1<br />
BASIN5<br />
BASIN11<br />
34<br />
BASIN9<br />
BASIN12<br />
BASIN14<br />
BASIN7
<strong>Goose</strong> <strong>Creek</strong> <strong>Watershed</strong> <strong>Management</strong> <strong>Plan</strong> <strong>Version</strong> 1...………………...October 31, 2009<br />
BASIN6<br />
Figure 21: Overall Impairment (based upon upland pollutant load).<br />
4.2 Stream Channel Characterization<br />
In order to prioritize areas of the <strong>Goose</strong> <strong>Creek</strong> <strong>Watershed</strong> for stream channel restoration,<br />
enhancement and preservation, a characterization methodology was developed by<br />
MCSWS. The characterization was completed through an evaluation of existing stream<br />
channel conditions that allowed reach-level prioritization based on biological integrity<br />
and geomorphic stability, as well as predicted bank erosion rates.<br />
4.2.1 Methodology<br />
BASIN8<br />
BASIN3<br />
BASIN10<br />
BASIN4<br />
BASIN13<br />
BASIN2<br />
BASIN1<br />
BASIN5<br />
BASIN11<br />
MCSWS utilized base data in GIS format, including recent aerial photography, stream<br />
locations, roads and parcel boundaries. Using GIS, the <strong>Goose</strong> <strong>Creek</strong> <strong>Watershed</strong> was<br />
divided into 30 separate reaches (Figure 22). For the purposes of this study, Buck defines<br />
a reach as a discrete segment of stream that consistently exhibits a set of physical features<br />
that appear to be significantly different from its contiguous upstream and downstream<br />
segments. Twelve basins were chosen for assessment that appeared to represent a range<br />
of stream conditions and land uses found throughout the watershed. Because perennial<br />
streams were to be assessed, only streams receiving 100 acres or greater of drainage were<br />
35<br />
BASIN9<br />
BASIN12<br />
BASIN14<br />
BASIN7
<strong>Goose</strong> <strong>Creek</strong> <strong>Watershed</strong> <strong>Management</strong> <strong>Plan</strong> <strong>Version</strong> 1...………………...October 31, 2009<br />
chosen, which resulted in 30 individual reaches approximating 30 miles of stream for<br />
direct assessment.<br />
Stream Classification<br />
Each reach was visually classified according to the Rosgen classification system (Rosgen,<br />
1994). This heirarchial methodology categorizes streams based on geomorphic features<br />
that describe channel geometry in the three dimensions of planform, cross-section and<br />
longitudinal profile. Most of these parameters are expressed as dimensionless ratios such<br />
as width/depth. The use of dimensionless ratios allows categorization and comparison of<br />
streams of varying sizes.<br />
Bank Erosion<br />
Streambank erosion rates were determined by measuring the Bank Erosion Hazard Index<br />
(BEHI) and Near Bank Stress (NBS) (Rosgen, 2001) throughout each study reach. This<br />
semi-quantitative method is widely used in North Carolina and is based on measured<br />
values and visual estimates made at discrete sections of streambank. BEHI provides<br />
results in adjective ratings, ranging from very low to extreme. BEHI is based on the<br />
following:<br />
• bank height/bankfull height<br />
• root depth/bank height<br />
• root density (%)<br />
• bank angle<br />
• surface protection (%)<br />
• bank materials and stratification<br />
NBS provides a measurement of the distribution of flow through a cross section. The<br />
near bank region is that third of stream cross section nearest a bank being studied.<br />
Rosgen (1996) correlated the ratio of shear stress in the near bank region to mean shear<br />
stress and developed an adjective rating system for reporting. Reasonably accurate<br />
estimates of NBS can be made quickly using professional judgment.<br />
Erosion rates have been associated with the adjective ratings for bank erodibility and<br />
near-bank stress based on data collected from Colorado. Data collected at the Mitchell<br />
River in North Carolina supports the use of the Colorado data (Rosgen, 2001). The<br />
erosion rate was then multiplied by the height and length of the streambank. Rates are<br />
expressed as cubic feet of sediment eroded annually per linear foot of streambank. Total<br />
tons per year were also calculated for each study reach.<br />
Channel Evolution<br />
Simon’s Channel Evolution Model (1989) was used to assign one of the six stages listed<br />
below to each reach based on field observations.<br />
• Stage I: The waterway is a stable, undisturbed natural channel.<br />
• Stage II: The channel is disturbed by some drastic change such as forest clearing,<br />
urbanization, dam construction, or channel dredging.<br />
36
<strong>Goose</strong> <strong>Creek</strong> <strong>Watershed</strong> <strong>Management</strong> <strong>Plan</strong> <strong>Version</strong> 1...………………...October 31, 2009<br />
• Stage III: Instability sets in with scouring of the bed.<br />
• Stage IV: Destructive bank erosion and channel widening occur by collapse of<br />
bank sections.<br />
• Stage V: The banks continue to cave into the stream, widening the channel. The<br />
stream also begins to aggrade, or fill in, with sediment from eroding channel<br />
sections upstream.<br />
• Stage VI: Aggradation continues to fill the channel, re-equilibrium occurs, and<br />
bank erosion ceases. Riparian vegetation once again becomes established.<br />
Habitat Assessment<br />
Mecklenburg County Habitat Assessment Protocol forms were completed by field staff<br />
and assigned a score per parameter with a total possible score of 200 being the best. The<br />
parameters of the habitat assessment are broken into primary, secondary, and tertiary<br />
categories. Primary parameters describe those instream physical characteristics that<br />
directly affect the biological community. Primary conditions evaluate substrate and<br />
available cover, embeddedness, epifaunal substrate, velocity and depth regimes, and pool<br />
variability. Secondary parameters (channel alteration, bottom scouring and deposition,<br />
channel shape, and channel sinuosity) relate to channel morphology, which controls the<br />
behavior of stream flow and the sediment deposits the stream collects. The tertiary<br />
parameters in the habitat assessment matrix include bank stability, bank vegetative<br />
protection, and the riparian vegetative zone. Each stream reach was photographed using a<br />
digital camera so that all aspects of the study area were photo-documented.<br />
37
<strong>Goose</strong> <strong>Creek</strong> <strong>Watershed</strong> <strong>Management</strong> <strong>Plan</strong> <strong>Version</strong> 1...………………...October 31, 2009<br />
DSTOUS179<br />
DSTOUS127<br />
DSTOUS132<br />
Figure 22: <strong>Goose</strong> <strong>Creek</strong> Stream Characterization Reaches.<br />
4.2.2 Results<br />
DSTOUS129<br />
DSTOUS211<br />
DSTOUS130<br />
DSTOUS134<br />
DSTOUS294<br />
DSTOUS210<br />
DSTOUS184<br />
USTODS135<br />
DSTOUS296<br />
DSTOUS213<br />
DSTOUS326<br />
DSTOUS142<br />
DSTOUS328<br />
DSTOUS215<br />
DSTOUS186<br />
DSTOUS357<br />
DSTOUS358<br />
DSTOUS187<br />
DSTOUS299<br />
DSTOUS297<br />
DSTOUS214<br />
A total of 30 study reaches were delineated and assessed. Reach lengths varied from<br />
several hundred feet to over 7000 feet. The number of reaches per basin ranged from<br />
three to seventeen. Once in the field the predetermined reach lengths (based on drainage)<br />
were sometimes broken into smaller reaches or combined into larger reaches based on<br />
field observations. For example, if the land use adjacent to the stream channel changed<br />
significantly (e.g., forest to industrial) a new reach would begin. Due to the large number<br />
of study reaches, data was also compiled and presented per basin (Table 17) to aid in<br />
management efforts.<br />
38<br />
DSTOUS329<br />
DSTOUS261<br />
USTODS394<br />
USTODS331<br />
USTODS333<br />
DSTOUS436
<strong>Goose</strong> <strong>Creek</strong> <strong>Watershed</strong> <strong>Management</strong> <strong>Plan</strong> <strong>Version</strong> 1...………………...October 31, 2009<br />
Table 17: Results of Stream Channel Characterization.<br />
Sediment<br />
Erosion Rate Production<br />
Reach (ft3/year/ft) (Tons/Year) MHAP Score Rank<br />
DSTOUS127 0.13 16 144 16<br />
DSTOUS129 0.55 158 143 25<br />
DSTOUS130 0.66 0.03 157 21<br />
DSTOUS132 0.53 54 149 19<br />
DSTOUS134 0.57 49 138 15<br />
DSTOUS142 1.0030 214 121 5<br />
DSTOUS179 0.10 15 144 27<br />
DSTOUS184 1.85 335 122 6<br />
DSTOUS186 1.12 221 130 8<br />
DSTOUS187 0.80 55 137 13<br />
DSTOUS210 1.22 136 125 7<br />
DSTOUS211 0.62 172 131 30<br />
DSTOUS213 0.59 189 132 24<br />
DSTOUS214 0.19 15 146 17<br />
DSTOUS215 0.60 83 134 10<br />
DSTOUS261 1.02 106 146 18<br />
DSTOUS294 0.60 123 115 23<br />
DSTOUS296 0.55 135 95 1<br />
DSTOUS297 0.55 61 136 12<br />
DSTOUS299 1.48 162 109 4<br />
DSTOUS326 0.78 179 111 22<br />
DSTOUS328 0.39 39 136 11<br />
DSTOUS329 0.85 212 108 2<br />
DSTOUS357 0.42 40 109 3<br />
DSTOUS358 1.14 91 92 14<br />
DSTOUS436 0.690 102 131 9<br />
USTODS135 1.45 210 124 29<br />
USTODS331 0.21 46 108 26<br />
USTODS333 1.19 450 117 28<br />
USTODS394 0.86 339 154 20<br />
Note: Decreasing MHAP score indicates greater impact.<br />
A single erosion rate was calculated for each of the 30 reaches based on BEHI/NBS.<br />
Based on correspondence with D. Rosgen (2008), categories of erosion rates are best<br />
assigned adjectives by orders of magnitude; therefore, rates of 0.01 feet/year are assigned<br />
the adjective ‘Low”, 0.1 feet/year are “Moderate”, and greater than or equal to 1.0<br />
feet/year are “High.”<br />
39
<strong>Goose</strong> <strong>Creek</strong> <strong>Watershed</strong> <strong>Management</strong> <strong>Plan</strong> <strong>Version</strong> 1...………………...October 31, 2009<br />
4.3 Fecal Coliform Assessment<br />
As described earlier in this document, a WQRP for the <strong>Goose</strong> <strong>Creek</strong> <strong>Watershed</strong> was<br />
initiated after receipt of the August 10, 2006 letter from NC DENR. A part of the WQRP<br />
was to catalog the storm water outfalls in the watershed. In order to satisfy the<br />
requirements of this inventory, all streams draining more than 50 acres were walked by<br />
MCWQP personnel. A part of the walk was to visually inspect the channel and buffer<br />
areas for evidence of fecal coliform discharges and to collect stream and end of pipe<br />
samples to be analyzed for fecal coliform. The results of the stream walks can be found<br />
in the MCWQP, 2007. In addition to the stream walks, the WQRP requires monitoring of<br />
storm drain outfalls, in stream monitoring and associated follow-up activities. These<br />
activities are outlined in MCWQP, 2009. Currently, the MCWQP has teamed with the<br />
Mecklenburg County Ground Water and Waste Water Program to evaluate septic systems<br />
in the watershed. At the time of writing of this plan a pilot study had been completed on<br />
a small area of the watershed. Approximately 180 inspections were conducted and 5<br />
systems were found to be failing. Based upon these results the pilot study will be<br />
expanded throughout the <strong>Goose</strong> <strong>Creek</strong> <strong>Watershed</strong> in Mecklenburg County and is<br />
expected to be completed by the end of FY2011.<br />
40
<strong>Goose</strong> <strong>Creek</strong> <strong>Watershed</strong> <strong>Management</strong> <strong>Plan</strong> <strong>Version</strong> 1...………………...October 31, 2009<br />
SECTION 5. CANDIDATE RESTORATION, RETROFIT AND<br />
PRESERVATION SITES<br />
5.1 Upland BMP Retrofit Sites<br />
The intent of this section is two fold:<br />
1. Identify publicly owned parcels that are significant sources of pollution that would<br />
benefit from BMP retrofit.<br />
2. Identify catchments for detailed field investigation to identify privately owned parcels<br />
that are significant sources of pollution and appropriate for BMP retrofit.<br />
All retrofit BMPs installed in the <strong>Goose</strong> <strong>Creek</strong> <strong>Watershed</strong> should be designed with the<br />
Upland Pollutant Loading Rate Goals (Table 11) as a design standard.<br />
5.1.1 Priority Basins<br />
Based upon the upland pollutant load analysis, BMP retrofit efforts should be<br />
concentrated on or downstream of the most impacted basins. The 6 most impacted basins<br />
were focused upon for this plan. Figure 23 shows the extent of these focus basins within<br />
the <strong>Goose</strong> <strong>Creek</strong> <strong>Watershed</strong>. The following Section discusses each focus basin in detail.<br />
BASIN6<br />
BASIN8<br />
BASIN3<br />
BASIN10<br />
BASIN4<br />
BASIN13<br />
BASIN2<br />
BASIN1<br />
BASIN5<br />
BASIN11<br />
Figure 23: Focus Basins within the <strong>Goose</strong> <strong>Creek</strong> <strong>Watershed</strong>.<br />
41<br />
BASIN9<br />
BASIN12<br />
BASIN14<br />
BASIN7
<strong>Goose</strong> <strong>Creek</strong> <strong>Watershed</strong> <strong>Management</strong> <strong>Plan</strong> <strong>Version</strong> 1...………………...October 31, 2009<br />
Focus Basin 11 (The Bridges)<br />
Focus Basin 11 has the highest estimated pollutant loads in the entire <strong>Goose</strong> <strong>Creek</strong><br />
<strong>Watershed</strong>. Figure 24 shows the extent of the Basin. The primary reason for Basin 11<br />
receiving the highest ranking is The Bridges mall site. Although the mall has not yet<br />
been built, grading permits have been issued and land clearing begun. Moreover, this<br />
basin contains much of the I-485 Lawyers Road interchange and a significant portion of<br />
I-485 north of the interchange. A limited amount of single family residential is also<br />
present in the basin. It is very likely that after the mall is constructed storm water volume<br />
and velocity as well as pollutant runoff will increase. Currently NCDOT owns one small<br />
parcel in the northeast portion of the basin on the drainage divide. This parcel may be<br />
suitable to treat a small portion of I-485.<br />
BASIN8<br />
BASIN8<br />
BASIN10<br />
BASIN13<br />
BASIN4<br />
Figure 24: Focus Basin 11<br />
Focus Basin 2 (Shannamara)<br />
BASIN1<br />
BASIN5<br />
Focus Basin 2 has the second highest estimated pollutant loads (normalized by area) in<br />
the entire <strong>Goose</strong> <strong>Creek</strong> <strong>Watershed</strong>. Figure 25 shows the extent of Focus Basin 2. The<br />
42<br />
BASIN11<br />
BASIN12<br />
BASIN9
<strong>Goose</strong> <strong>Creek</strong> <strong>Watershed</strong> <strong>Management</strong> <strong>Plan</strong> <strong>Version</strong> 1...………………...October 31, 2009<br />
combination of I-485 road surface, golf course and medium density residential combines<br />
to cause the high pollutant loads. There appears to be minimal opportunity for land<br />
acquisition in Focus Area 1, however NC DOT has indicated their desire to partner with<br />
MCSWS within road ROW. There is very limited retrofit opportunity within the<br />
Shannamara neighborhood.<br />
B A S I N 3<br />
Figure 25: Focus Basin 2<br />
B A S I N 2<br />
Focus Basin 5 (Lawyers Road and I-485)<br />
Figure 26 shows the extent of Focus Basin 5. It is comprised of I-485 with limited large<br />
lot residential. The key to this basin is capturing and treating runoff from I-485. NC<br />
DOT owns property where runoff from I-485 enters <strong>Goose</strong> <strong>Creek</strong>. During the site<br />
evaluation there appeared to be an impoundment on this property that may partially treat<br />
the runoff. Additional measures will need to be constructed to provide additional<br />
treatment to meet the goals outlined previously, particularly for NH4 and fecal coliform.<br />
43<br />
B A S I N 1 3<br />
B A S I N 5
<strong>Goose</strong> <strong>Creek</strong> <strong>Watershed</strong> <strong>Management</strong> <strong>Plan</strong> <strong>Version</strong> 1...………………...October 31, 2009<br />
B A S I N 1 0<br />
19517156<br />
19524101<br />
B A S I N 1 3<br />
B A S I N 4<br />
B A S I N 2<br />
B A S I N 2<br />
Figure 26: Focus Basin 5 (Note: Publicly owned property shown in yellow).<br />
Focus Basin 4 (Lawyers Road)<br />
19514196<br />
B A S I N 5<br />
19514219<br />
19514129<br />
B A S I N 1 1<br />
Figure 27 displays the extent of Focus Basin 4. It is essentially bisected by Lawyers<br />
Road from north to south. There is a substantial impoundment located in the center of<br />
the basin that could be retrofitted to provide detention and additional water quality<br />
treatment. The pond is currently poorly maintained and possibly a source of sediment.<br />
The headwaters of the basin are located at NC 51 and dominated by Queens Grant<br />
School. Bain Elementary School has an existing rain garden that treats a portion of a<br />
parking lot. Additional infiltration features should be retrofitted into the site. The basin<br />
is typified by agricultural plots with large lot residential and less medium density<br />
residential.<br />
44<br />
19514183<br />
19514208<br />
19514211<br />
19706218<br />
B A S I N 9
<strong>Goose</strong> <strong>Creek</strong> <strong>Watershed</strong> <strong>Management</strong> <strong>Plan</strong> <strong>Version</strong> 1...………………...October 31, 2009<br />
B A S I N 6<br />
B A S I N 8<br />
B A S I N 3<br />
Figure 27: Focus Basin 4.<br />
Focus Basin 6 (Well Road)<br />
B A S I N 4<br />
Figure 28 shows the distribution of Focus Basin 6, which is dominated by McWhirter<br />
Lake. It is essential for this catchment that McWhirter Lake remain intact and enhanced<br />
if possible. It provides significant treatment for several medium density residential<br />
developments and commercial areas.<br />
45<br />
B A S I N 1<br />
B A S I N 1 1<br />
B A S I N 1 0 B A S I N 5<br />
B A S I N 1 3<br />
B A S I N 1 2<br />
B A S I N 9
<strong>Goose</strong> <strong>Creek</strong> <strong>Watershed</strong> <strong>Management</strong> <strong>Plan</strong> <strong>Version</strong> 1...………………...October 31, 2009<br />
B A S I N 6<br />
Figure 28: Focus Basin 6 (Public Parcels in Yellow).<br />
46<br />
19503104<br />
19503106<br />
B A S I N 8<br />
B A S I N 1 0<br />
B A S I N 3
<strong>Goose</strong> <strong>Creek</strong> <strong>Watershed</strong> <strong>Management</strong> <strong>Plan</strong> <strong>Version</strong> 1...………………...October 31, 2009<br />
Public Parcels<br />
The intent of this Section is to identify publicly owned parcels for BMP retrofit.<br />
Specifically, publicly owned parcels that are significant sources of pollution and are<br />
located in one of the “Focus” areas have been assigned the highest priority.<br />
There are currently 20 parcels in public ownership in the <strong>Goose</strong> <strong>Creek</strong> <strong>Watershed</strong>. These<br />
parcels are located throughout the watershed, but are mainly focused in areas around I-<br />
485 and Lawyers Road. Where beneficial to water quality, these properties should be<br />
further investigated to determine the final suitability for BMP installation using this<br />
report as a guide. Figure 29 shows the distribution of the parcels in public ownership in<br />
the <strong>Goose</strong> <strong>Creek</strong> <strong>Watershed</strong>. The parcels were evaluated and prioritized using the<br />
following criteria:<br />
1. Position either on or downstream of a basin with a high or moderately high overall<br />
rank for upland pollutant loading.<br />
2. Proximity to the stream. Parcels directly adjacent to the stream were ranked higher.<br />
3. Parcels with adequate space for installation of reasonably sized BMPs were ranked<br />
higher. If there did not appear to be enough space for a BMP, the parcel was<br />
disqualified.<br />
4. Parcels receiving runoff from more than two square miles were disqualified.<br />
5. Parcels able to treat high concentrations of impervious area, regardless of size were<br />
ranked higher.<br />
Of the 20 public parcels in the <strong>Goose</strong> <strong>Creek</strong> <strong>Watershed</strong>, 4 meet the criteria listed above.<br />
The Priority Parcels are presented in Table 18. Figures 30 – 32 are aerial photos of the<br />
High Priority Parcels.<br />
47
<strong>Goose</strong> <strong>Creek</strong> <strong>Watershed</strong> <strong>Management</strong> <strong>Plan</strong> <strong>Version</strong> 1...………………...October 31, 2009<br />
BASIN6<br />
BASIN8<br />
BASIN3<br />
BASIN10<br />
BASIN2<br />
BASIN4<br />
BASIN13<br />
BASIN1<br />
BASIN5<br />
BASIN11<br />
Figure 29: <strong>Goose</strong> <strong>Creek</strong> <strong>Watershed</strong> Public Parcels.<br />
Table 18: Public Parcels Meeting BMP Criteria and Priority.<br />
Parcel Owner Info. Priority<br />
19701146 CHARLOTTE MECKLENBURG SCHOOLS Medium<br />
19514129 DEPT OF TRANSPORTATION High<br />
19514183 DEPT OF TRANSPORTATION Low<br />
19514196 DEPT OF TRANSPORTATION Low<br />
19514208 DEPT OF TRANSPORTATION Low<br />
19514211 DEPT OF TRANSPORTATION Medium<br />
19514219 DEPT OF TRANSPORTATION High<br />
19523107 DEPT OF TRANSPORTATION Low<br />
19523204 DEPT OF TRANSPORTATION Low<br />
19704137 DEPT OF TRANSPORTATION Low<br />
19704138 DEPT OF TRANSPORTATION Low<br />
19706218 DEPT OF TRANSPORTATION Low<br />
19720106 DEPT OF TRANSPORTATION Low<br />
19720111 DEPT OF TRANSPORTATION Low<br />
19720199 DEPT OF TRANSPORTATION Low<br />
19503104 MECKLENBURG COUNTY Low<br />
19503106 MECKLENBURG COUNTY Low<br />
19517156 MECKLENBURG COUNTY Low<br />
19523106 MECKLENBURG COUNTY Low<br />
19524101 MECKLENBURG COUNTY Low<br />
48<br />
BASIN9<br />
BASIN12<br />
BASIN14<br />
BASIN7
<strong>Goose</strong> <strong>Creek</strong> <strong>Watershed</strong> <strong>Management</strong> <strong>Plan</strong> <strong>Version</strong> 1...………………...October 31, 2009<br />
19514219<br />
19514129<br />
Figure 30: Aerial Photo of Parcels 19514219 (High Priority), 19514129 (High<br />
Priority) and 19514208 (Low Priority).<br />
49<br />
19514208
<strong>Goose</strong> <strong>Creek</strong> <strong>Watershed</strong> <strong>Management</strong> <strong>Plan</strong> <strong>Version</strong> 1...………………...October 31, 2009<br />
19701146<br />
19701146<br />
19701146<br />
Figure 31: Aerial Photo of Parcel 19701146 (Medium Priority).<br />
50
<strong>Goose</strong> <strong>Creek</strong> <strong>Watershed</strong> <strong>Management</strong> <strong>Plan</strong> <strong>Version</strong> 1...………………...October 31, 2009<br />
19720111<br />
19720106<br />
Figure 32: Aerial Photo of Parcels 19720111(Low Priority) and 19720106 (Low<br />
Priority).<br />
5.2 Stream Channel <strong>Management</strong> Opportunities<br />
The management opportunities outlined in this plan are based on numerous<br />
considerations. The analysis of collected data easily allows a ranked hierarchy based on<br />
need; however, project feasibility is of equal importance and takes in account additional<br />
factors. For example, the location of utility right-of-ways can constrain design parameters<br />
or could be costly to relocate. The number of private property owners within the<br />
proposed project area plays a crucial role in determining scope and size. The procurement<br />
of easements can be challenging and time consuming, as a result, the lower number of<br />
adjacent land owners is considered more favorable. The presence and condition of a<br />
riparian buffer can also be a deciding factor during the prioritization process. A stream<br />
with little to no buffer is often highly prioritized. An intact buffer can hasten the lateral<br />
instability commonly found in the streams of <strong>Goose</strong> <strong>Creek</strong> <strong>Watershed</strong>. Also, riparian<br />
buffers with large mature trees increase cost and may limit restoration and enhancement<br />
techniques available. Table 19 identifies the highest priority stream reaches in the <strong>Goose</strong><br />
<strong>Creek</strong> <strong>Watershed</strong>.<br />
51<br />
19720199
<strong>Goose</strong> <strong>Creek</strong> <strong>Watershed</strong> <strong>Management</strong> <strong>Plan</strong> <strong>Version</strong> 1...………………...October 31, 2009<br />
For the purposes of mitigation credit, the US Army Corps of Engineers defines<br />
restoration and enhancement as follows (USACE, 2003):<br />
Restoration – the process of converting an unstable altered or degraded stream corridor,<br />
including adjacent buffers and flood prone areas, to its natural stable condition. Restoration<br />
is based on reference conditions and includes restoring the appropriate channel dimension,<br />
pattern and profile. For impacts to fair or poor quality waters, the mitigation credit ratio is<br />
generally 1.0 (i.e. for every 100 feet of stream impact, 100 feet of stream restoration would<br />
be required for mitigation).<br />
Enhancement Level I – mitigation category that includes improvements to the stream<br />
channel and riparian zone that restore dimension and profile, but do not address pattern.<br />
required for every 100 feet of impact).<br />
Enhancement Level II – mitigation category for measures that improve channel stability,<br />
water quality and habitat, but fall short of restoring both dimension and profile.<br />
Examples include bank stabilization, vegetating riparian buffers and using in-stream<br />
structures to enhance stability and habitat.<br />
Table 19: Highest Priority <strong>Goose</strong> <strong>Creek</strong> Stream Reaches<br />
Reach Rank<br />
DSTOUS296 1<br />
DSTOUS329 2<br />
DSTOUS357 3<br />
DSTOUS299 4<br />
DSTOUS142 5<br />
DSTOUS184 6<br />
Reach DSTOUS296<br />
Reach DSTOUS296 is located in Basin 14 upstream of an impoundment (see Figure 33).<br />
There is rip-rap on the upstream portion of the reach and the trees have good root depth.<br />
Gravel riffles, and a beaver dam are present. 300 ft of stream has been denuded from<br />
beaver dam breach. Woody debris and root mats form habitat. Some mid-channel bars<br />
exist. Bedrock nick-points present. Recommendation is Enhancement Level 1.<br />
Recommendation: Enhancement Level 1<br />
Estimated Cost: $844,735<br />
System: Minor<br />
52
<strong>Goose</strong> <strong>Creek</strong> <strong>Watershed</strong> <strong>Management</strong> <strong>Plan</strong> <strong>Version</strong> 1...………………...October 31, 2009<br />
DSTOUS294<br />
Figure 33: Reach DSTOUS296 Area Map.<br />
Reach DSTOUS329<br />
DSTOUS296<br />
Reach DSTOUS329 is located in Basin 12 and flows through a relatively undeveloped<br />
stream corridor (see Figure 34). There is a well-vegetated buffer, except the downstream<br />
left bank is pasture. Banks are vegetated thoroughly with shrub and trees. Bed is<br />
composed of silt and sand. Several beaver dams are present. Downstream area has<br />
extreme bank erosion from cattle.<br />
Recommendation: Enhancement Level 1<br />
Estimated Cost: $851,879<br />
System: Minor<br />
53<br />
DSTOUS326<br />
DSTOUS358
<strong>Goose</strong> <strong>Creek</strong> <strong>Watershed</strong> <strong>Management</strong> <strong>Plan</strong> <strong>Version</strong> 1...………………...October 31, 2009<br />
Figure 34: Reach DSTOUS329 Area Map.<br />
Reach DSTOUS357<br />
Reach DSTOUS357 is located in Basin 1 and flows through a relatively undeveloped<br />
stream corridor (see Figure 35). A significant head-cut is present and the stream has a<br />
sandy bottom. Several bedrock nick-points were noted. Numerous deep pools below<br />
blockages have formed. Poor riffle pool sequence was noted. Numerous vegetated point<br />
bars and bank full benches present. Reach receives significant concentrated runoff from<br />
I-485.<br />
Recommendation: Restoration<br />
Estimated Cost: $349,193<br />
System: Minor<br />
54<br />
DSTOUS329<br />
USTODS331
<strong>Goose</strong> <strong>Creek</strong> <strong>Watershed</strong> <strong>Management</strong> <strong>Plan</strong> <strong>Version</strong> 1...………………...October 31, 2009<br />
DSTOUS326<br />
Figure 35: Reach DSTOUS357 Area Map.<br />
Reach DSTOUS299<br />
DSTOUS358<br />
Reach DSTOUS299 is located in Basin 1 and flows through a relatively undeveloped<br />
stream corridor downstream of DSTOUS357 (see Figure 36). It may be beneficial to<br />
combine these two projects into a single effort. Livestock have access to the stream<br />
causing significant localized erosion and cows were noted in-stream at the time of<br />
assessment. Fencing of the livestock out of the creek should be a part of any restoration<br />
or enhancement effort. Notable bedrock and cobble are present. Pools are actively filling<br />
with sand and silt. Most of the entire stream reach is severely impacted by cattle. High<br />
BEHI with low NBS was noted. Good ripple pool sequence, very long riffles with<br />
cobbles and boulders.<br />
Recommendation: Restoration<br />
Estimated Cost: $397,271<br />
System: Major<br />
DSTOUS328<br />
55<br />
DSTOUS357
<strong>Goose</strong> <strong>Creek</strong> <strong>Watershed</strong> <strong>Management</strong> <strong>Plan</strong> <strong>Version</strong> 1...………………...October 31, 2009<br />
Figure 36: Reach DSTOUS299 Area Map.<br />
Reach DSTOUS142<br />
DSTOUS326<br />
Reach DSTOUS142 is located in Basin 13 and flows through a relatively undeveloped<br />
stream corridor that is almost entirely in public ownership (see Figure 37). Good riffle<br />
pool frequency; pools shallow; riffles embedded with course sand. Mid-channel bars<br />
present. Bed is fully shaded with mature vegetation. Habitat consists of large cobble and<br />
boulders. Banks are raw due to little surface coverage, good root depth from hardwoods<br />
at top of bank. Bedrock nick-points throughout the reach were noted.<br />
Recommendation: Restoration<br />
Estimated Cost: $774,953<br />
System: Major<br />
DSTOUS328<br />
DSTOUS299<br />
DSTOUS215<br />
56<br />
DSTOUS297
<strong>Goose</strong> <strong>Creek</strong> <strong>Watershed</strong> <strong>Management</strong> <strong>Plan</strong> <strong>Version</strong> 1...………………...October 31, 2009<br />
DSTOUS184<br />
USTODS135<br />
Figure 37: Reach DSTOUS142 Area Map.<br />
Reach DSTOUS184<br />
Reach DSTOUS184 is located in Basin 10 and flows through a developed stream corridor<br />
just upstream of DSTOUS142 (see Figure 38). These 2 reaches should be combined into<br />
a single project if possible. Stream is vertically stable, and actively aggrading with<br />
coarse sediment from upstream bank erosion. Stream is over-widening. Left bank buffer<br />
protection is inadequate and a good candidate for reforestation. Gravel and small boulder<br />
riffles present with poor frequency. Good pool depth variation bed is partially shaded.<br />
Banks are partially vegetated with grass and shrubs. Deep pools are limited to meanders<br />
and are actively filling with sand. Mid-channel bars of gravel were noted. Log jams were<br />
observed within the lower portion of the bank. Good surface protection. Invasive plant<br />
species are present throughout. Several transverse bars present. Habitat consists of<br />
undercut banks and large cobble.<br />
Recommendation: Restoration<br />
Estimated Cost: $660,333<br />
System: Major<br />
57<br />
DSTOUS142<br />
DSTOUS186
<strong>Goose</strong> <strong>Creek</strong> <strong>Watershed</strong> <strong>Management</strong> <strong>Plan</strong> <strong>Version</strong> 1...………………...October 31, 2009<br />
DSTOUS211<br />
DSTOUS210<br />
Figure 38: Reach DSTOUS184 Area Map.<br />
5.3 Stream Buffer Restoration Areas<br />
The intent of this section is to identify basins with the highest percentage of impacted<br />
(un-forested) stream buffer. Table 20 and Figure 39 present the results of the tree canopy<br />
analysis. All of the basins had more that 74% of the buffer forested which is significant.<br />
Also, the data utilized to prepare the estimates is almost 10 years old and a grant has been<br />
applied for to update the information. At this time, it is recommended that prior to the<br />
initiation of any projects the analysis be redone with the anticipated updated information.<br />
58<br />
DSTOUS184<br />
USTODS135<br />
DSTOUS142<br />
DSTOUS213
<strong>Goose</strong> <strong>Creek</strong> <strong>Watershed</strong> <strong>Management</strong> <strong>Plan</strong> <strong>Version</strong> 1...………………...October 31, 2009<br />
Table 20: Results of the Stream Buffer Tree Canopy Analysis<br />
Basin<br />
Percent of Buffer<br />
Intact Rank<br />
BASIN6 74% 1<br />
BASIN5 81% 2<br />
BASIN4 87% 3<br />
BASIN12 89% 4<br />
BASIN2 89% 5<br />
BASIN3 89% 6<br />
BASIN11 91% 7<br />
BASIN13 91% 8<br />
BASIN1 91% 9<br />
BASIN9 93% 10<br />
BASIN8 95% 11<br />
BASIN10 95% 12<br />
BASIN14 96% 13<br />
BASIN7 98% 14<br />
B A S I N 6<br />
B A S I N 8<br />
B A S I N 4<br />
B A S I N 1 0<br />
B A S I N 1<br />
B A S I N 5<br />
B A S I N 3<br />
B A S I N 1 3<br />
B A S I N 2<br />
Figure 39: Results of the Tree Canopy Analysis (priority basins are outlined in red).<br />
59<br />
B A S I N 1 2<br />
B A S I N 1 1<br />
B<br />
1<br />
B A S I N 9<br />
B A S I N 1 4<br />
B A S I N 7
<strong>Goose</strong> <strong>Creek</strong> <strong>Watershed</strong> <strong>Management</strong> <strong>Plan</strong> <strong>Version</strong> 1...………………...October 31, 2009<br />
5.4 Master <strong>Plan</strong>ning for Restoration, Retrofit and Preservation Projects<br />
A minimum of two (2) detailed Master <strong>Plan</strong>s will be developed to guide restoration,<br />
retrofit and preservation projects in the <strong>Goose</strong> <strong>Creek</strong> <strong>Watershed</strong>. The goal of these<br />
Master <strong>Plan</strong>s is to restore <strong>Goose</strong> <strong>Creek</strong> to a fully functioning and supporting stream<br />
ecosystem. The Master <strong>Plan</strong>ning process will start in the Focus Basins identified in<br />
Section 5.1.1 where the most impaired catchments are located. The planning process will<br />
begin with a thorough evaluation of all properties (including public and private) located<br />
in these Focus Basins to identify specific opportunities for restoration, retrofit and<br />
preservation projects, including properties to be recommended for acquisition by the<br />
County due to their water quality benefit. After the tree canopy data set is updated<br />
(expected in January 2010) specific recommendations will be made regarding buffer<br />
reforestation projects. The highest priority will be given to potential projects (including<br />
BMP retrofits, buffer reforestations and stream channel restorations) located on publicly<br />
owned properties. However, public property in the watershed is limited. Consideration<br />
will be given to the initiation of these projects as soon as possible. Once potential<br />
projects have been identified, a draft budget will be developed and funding sources<br />
specified. If grants will be included as a funding source, the grants and funding cycles<br />
will be specified as well as the necessary local match. At a minimum, the Master <strong>Plan</strong>s<br />
will include the following:<br />
• Specific location of all recommended projects (include on map).<br />
• Detailed description of the projects, including type, size, etc. (include preliminary<br />
design sketches of the projects)<br />
• Water quality benefit of the projects, including an estimate of pollutant removal<br />
capabilities.<br />
• Budgets and funding sources for the projects.<br />
• Individual project prioritization.<br />
• Major or minor system.<br />
An important component of maintaining water quality conditions in <strong>Goose</strong> <strong>Creek</strong> is<br />
ensuring the proper operation and maintenance of BMPs and septic systems installed to<br />
date to mitigate impacts from existing development as well as retrofit BMPs installed<br />
through the implementation of the Master <strong>Plan</strong>s. This effort will begin in April of 2009<br />
and continue through December 2009 and will include the identification and inspection of<br />
all existing BMPs and at least 200 septic systems in the watershed. Deficiencies detected<br />
will be reported to responsible parties for correction. A regular schedule of BMP<br />
inspections in the watershed will be developed and implemented for both public and<br />
private BMPs.<br />
60
<strong>Goose</strong> <strong>Creek</strong> <strong>Watershed</strong> <strong>Management</strong> <strong>Plan</strong> <strong>Version</strong> 1...………………...October 31, 2009<br />
SECTION 6. MEASURING SUCCESS AND ADAPTIVE MANAGEMENT<br />
6.1 Establishing an Ongoing Water Quality Monitoring Program<br />
As discussed in Section 2.2, Mecklenburg County has historically collected water and<br />
macroinvertebrate samples from <strong>Goose</strong> <strong>Creek</strong> at monitoring site MY9, which is located<br />
at Stevens Mill Road in Union County approximately 4000 feet downstream of the<br />
Mecklenburg County and Union County line (see Figure 2). There is a USGS stream<br />
gage at <strong>Goose</strong> <strong>Creek</strong> and Mill Grove Road in Union County. A thorough evaluation has<br />
been completed of the historical chemical, physical and biological monitoring activities<br />
in the watershed and routine monitoring is being conducted to provide baseline data to<br />
measure the effectiveness of restoration measures as they are implemented<br />
6.2 Annual Status Report<br />
By December 31 of every year beginning in 2009 and continuing through the completion<br />
of the <strong>Watershed</strong> <strong>Management</strong> <strong>Plan</strong> (anticipated for December 31, 2024), the<br />
Mecklenburg County Water Quality Program will complete a <strong>Goose</strong> <strong>Creek</strong> <strong>Watershed</strong><br />
<strong>Management</strong> <strong>Plan</strong> Annual Status Report to at a minimum include the following<br />
information:<br />
• Status of compliance with goals identified in Table 12.<br />
• Status of all projects underway in the watershed.<br />
• Recommended changes to <strong>Watershed</strong> <strong>Management</strong> <strong>Plan</strong>.<br />
This report will be made available to all the key players involved in the implementation<br />
of the <strong>Watershed</strong> <strong>Management</strong> <strong>Plan</strong>, including the Director of Water & Land Resources,<br />
Manager of Storm Water Engineering, Manager of the Water Quality Program,<br />
Supervisor of the Yadkin Section and a representative from the Town of Mint Hill. This<br />
group will serve as the “<strong>Watershed</strong> <strong>Management</strong> Evaluation Team.”<br />
6.3 Adaptive <strong>Management</strong><br />
The <strong>Watershed</strong> <strong>Management</strong> Evaluation Team will meet at least annually following the<br />
completion of each <strong>Watershed</strong> <strong>Management</strong> <strong>Plan</strong> Annual Status Report to evaluate the<br />
effectiveness of the <strong>Plan</strong> at meeting the goals reported as outlined in Section 6.2. This<br />
evaluation will be based on the data and information contained in the Annual Report as<br />
well as other pertinent facts and information provided regarding the effectiveness of the<br />
<strong>Plan</strong> at meeting established goals. During these meetings, consideration will also be<br />
given as to the effectiveness of the goals at measuring the effectiveness of the <strong>Plan</strong>. It<br />
may be necessary that goals be changed or that changes be made to the <strong>Plan</strong>. These<br />
changes will be reflected in the <strong>Watershed</strong> <strong>Management</strong> <strong>Plan</strong> and will become effective<br />
immediately.<br />
61
<strong>Goose</strong> <strong>Creek</strong> <strong>Watershed</strong> <strong>Management</strong> <strong>Plan</strong> <strong>Version</strong> 1...………………...October 31, 2009<br />
SECTION 7. CONCLUSION<br />
The <strong>Goose</strong> <strong>Creek</strong> <strong>Watershed</strong> has been designated critical habitat for the federally<br />
endangered Carolina Heelsplittter mussel and a Water Quality Recovery Program for<br />
fecal coliform has been developed for the watershed. Implementation of the Site Specific<br />
<strong>Management</strong> <strong>Plan</strong> is expected to prevent continued degradation of stream water quality<br />
from new development; however, pre-existing sources of pollution remain partially or<br />
completely un-mitigated. In order to restore the water quality in <strong>Goose</strong> <strong>Creek</strong>, preexisting<br />
sources of pollution will need to be mitigated and in-stream stressors to benthic<br />
macroinvertebrate life removed. In this way Mecklenburg County can achieve its<br />
ultimate goal for <strong>Goose</strong> <strong>Creek</strong> of improving water quality conditions such that designated<br />
uses are met and the creek is no longer impaired. The effective implementation of this<br />
<strong>Watershed</strong> <strong>Management</strong> <strong>Plan</strong> will enable this to be accomplished but it will take time. It<br />
is currently anticipated that this process will take a minimum of 15 years between 2009<br />
and 2024.<br />
62
<strong>Goose</strong> <strong>Creek</strong> <strong>Watershed</strong> <strong>Management</strong> <strong>Plan</strong> <strong>Version</strong> 1...………………...October 31, 2009<br />
Appendix A<br />
References<br />
Alan, C.J., 2004. Water Quality and Stream Stability Monitoring for <strong>Goose</strong> <strong>Creek</strong><br />
Mecklenburg and Union Counties, North Carolina 2001 - 2003. US Department<br />
of Transportation, Research and Special Programs Administration, 400 7 th Street,<br />
SW, Washington, DC 20590-0001. Report number 2004-06.<br />
Bales, J.D., J.C. Weaver, and J.B. Robinson. 1999. Relation of Land Use to Streamflow<br />
and Water Quality at Selected Sites in the City of <strong>Charlotte</strong> and Mecklenburg<br />
County, North Carolina, 1993-98. USGS Water-Resources Investigations Report<br />
99-4180. Raleigh, NC.<br />
CH2MHill, 2003, <strong>Charlotte</strong> Area Local <strong>Watershed</strong> <strong>Plan</strong>. Prepared for North Carolina<br />
Wetlands Restoration Program, Raleigh, North Carolina.<br />
<strong>Charlotte</strong>-Mecklenburg Storm Water Services, 1997, Mecklenburg County Floodplain<br />
<strong>Management</strong> Guidance Document. <strong>Charlotte</strong>, NC<br />
U.S. Department of Agriculture – Soil Conservation Service, 1980, Soil Survey of<br />
Mecklenburg County, North Carolina. U.S. Government Printing Office: 1979—<br />
273-222/11.<br />
Ferrell, G.M., 2001, Effects of Land Use on Water Quality and Transport of Selected<br />
Constituents in Streams in Mecklenburg County, North Carolina, 1994-98. USGS<br />
Water-Resources Investigations Report 01-4118. Raleigh, North Carolina.<br />
Fridell, J.A., 1997, Recovery <strong>Plan</strong> for Carolina Heelsplitter (Lasmigona decorate) Lea.<br />
U.S. Fish and Wildlife Service, Southeast Region. Atlanta Georgia.<br />
Mecklenburg County Water Quality Program and NC Department of Environment and<br />
Natural Resources Division of Water Quality, 2005, Total Maximum Daily Loads<br />
for Fecal Coliform for <strong>Goose</strong> <strong>Creek</strong>, North Carolina [Waterbody ID NC_13-17-<br />
18A and 13-17-18b). 1617 Mail Service Center, Raleigh, NC 27699-1617.<br />
Mecklenburg County Water Quality Program, 2007, <strong>Goose</strong> <strong>Creek</strong> Recovery Program for<br />
Fecal Coliform Bacteria - Stream Walk Final Report. 700 North Tryon Street,<br />
<strong>Charlotte</strong>, NC.<br />
Mecklenburg County Water Quality Program, 2009, Water Quality Monitoring <strong>Plan</strong> for<br />
<strong>Goose</strong> <strong>Creek</strong> <strong>Watershed</strong> Water Quality Recovery Program for Fecal Coliform<br />
Bacteria. 700 North Tryon Street, <strong>Charlotte</strong>, NC.<br />
North Carolina, 2004, North Carolina Water Quality Assessment and Impaired Waters<br />
List (2004 Integrated 305(b) and 303(d) Report) – Public Review Draft, accessed<br />
August 15, 2005, at URL http://h2o.enr.state.nc.us/tmdl/documents/<br />
63
<strong>Goose</strong> <strong>Creek</strong> <strong>Watershed</strong> <strong>Management</strong> <strong>Plan</strong> <strong>Version</strong> 1...………………...October 31, 2009<br />
2004IntegratedReporttext_001.pdf<br />
North Carolina, 2003, Yadkin-Pee Dee River Basinwide Water Quality <strong>Plan</strong>, March<br />
2003, at URL<br />
http://h2o.enr.state.nc.us/basinwide/yadkin/Yadkin%20final%202003%20BP/Yad<br />
kin%20final%20complete%20plan%204103.pdf<br />
Robinson, J.B., W.F. Hazell, and R.G. Garrett. 1996. Precipitation, Streamflow, and<br />
Water-Quality Data from Selected Sites in the City of <strong>Charlotte</strong> and Mecklenburg<br />
County, North Carolina, 1993-95. USGS Open-File Report 96-150. Raleigh, NC.<br />
Robinson, J.B., W.F. Hazell, and R.G. Garrett. 1998. Precipitation, Streamflow, and<br />
Water-Quality Data from Selected Sites in the City of <strong>Charlotte</strong> and Mecklenburg<br />
County, North Carolina, 1995-97. USGS Open-File Report 98-67. Raleigh, NC.<br />
Rosgen, D. 2008. Personal communication with Brian Sikes, Mecklenburg County<br />
Storm Water Services.<br />
Sarver, K.M. and B.C. Steiner. 1998. Hydrologic and Water-Quality Data from Mountain<br />
Island Lake, North Carolina, 1994-97. USGS Open-File Report 98-549. Raleigh,<br />
NC.<br />
Sarver, K.M., W.F. Hazell, and J.B. Robinson. 1999. Precipitation, Atmospheric<br />
Deposition, Streamflow, and Water-Quality Data from Selected Sites in the City<br />
of <strong>Charlotte</strong> and Mecklenburg County, North Carolina, 1997-98. USGS Open-File<br />
Report 99-273. Raleigh, NC.<br />
Tetra Tech, Inc., 2004, Post Construction Ordinance Development Phase I Report –<br />
Draft. Prepared for Mecklenburg County Water Quality Program and <strong>Charlotte</strong><br />
Storm Water Services, Mecklenburg County, North Carolina.<br />
Tetra Tech, Inc., 2005, Mecklenburg County Site Evaluation Tool Model Documentation.<br />
Prepared for Mecklenburg County Water Quality Program, Mecklenburg County,<br />
North Carolina.<br />
64