Goose Creek Watershed Management Plan Version - Charlotte ...
Goose Creek Watershed Management Plan Version - Charlotte ...
Goose Creek Watershed Management Plan Version - Charlotte ...

Create successful ePaper yourself
Turn your PDF publications into a flip-book with our unique Google optimized e-Paper software.
<strong>Goose</strong> <strong>Creek</strong> <strong>Watershed</strong> <strong>Management</strong> <strong>Plan</strong> <strong>Version</strong> 1...………………...October 31, 2009<br />
place to protect the Carolina Heelsplitter Mussel essentially prohibited construction of the<br />
plant.<br />
2.1.5 North Carolina Ecosystem Enhancement Program<br />
The North Carolina Ecosystem Enhancement Program (EEP) is currently conducting a<br />
study in the <strong>Goose</strong> <strong>Creek</strong> <strong>Watershed</strong> to establish a Local Area <strong>Watershed</strong> <strong>Plan</strong> (LAWP)<br />
to identify mitigation opportunities in the <strong>Watershed</strong>. In the past, EEP LAWPs have not<br />
met the needs of local governments in Mecklenburg County however the process has<br />
been modified and may provide useful information. No completion date was available at<br />
the time of preparation of this document. EEP has established a stakeholder group of<br />
technical resources that is participating in their process. They intend for the stakeholder<br />
group to assume the role of implementing the findings of the LAWP that are not pertinent<br />
to EEP goals. These findings may include ordinance modification, BMP construction,<br />
stream enhancement or restoration and education efforts.<br />
2.2.1 Water Chemistry<br />
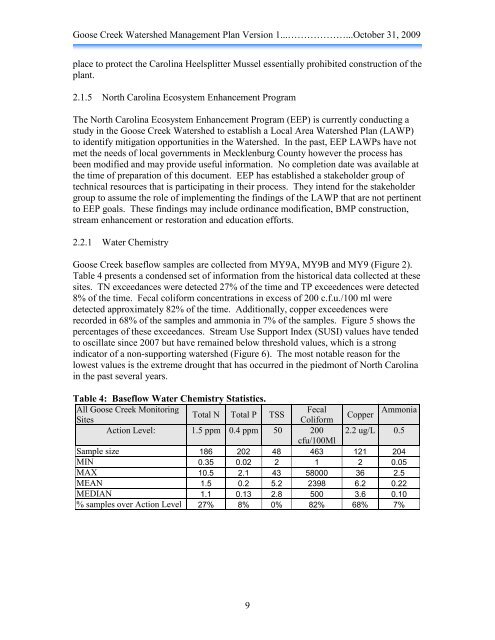
<strong>Goose</strong> <strong>Creek</strong> baseflow samples are collected from MY9A, MY9B and MY9 (Figure 2).<br />
Table 4 presents a condensed set of information from the historical data collected at these<br />
sites. TN exceedances were detected 27% of the time and TP exceedences were detected<br />
8% of the time. Fecal coliform concentrations in excess of 200 c.f.u./100 ml were<br />
detected approximately 82% of the time. Additionally, copper exceedences were<br />
recorded in 68% of the samples and ammonia in 7% of the samples. Figure 5 shows the<br />
percentages of these exceedances. Stream Use Support Index (SUSI) values have tended<br />
to oscillate since 2007 but have remained below threshold values, which is a strong<br />
indicator of a non-supporting watershed (Figure 6). The most notable reason for the<br />
lowest values is the extreme drought that has occurred in the piedmont of North Carolina<br />
in the past several years.<br />
Table 4: Baseflow Water Chemistry Statistics.<br />
All <strong>Goose</strong> <strong>Creek</strong> Monitoring<br />
Sites<br />
Total N Total P TSS<br />
Fecal<br />
Coliform<br />
Action Level: 1.5 ppm 0.4 ppm 50 200<br />
cfu/100Ml<br />
9<br />
Ammonia<br />
Copper<br />
2.2 ug/L 0.5<br />
Sample size 186 202 48 463 121 204<br />
MIN 0.35 0.02 2 1 2 0.05<br />
MAX 10.5 2.1 43 58000 36 2.5<br />
MEAN 1.5 0.2 5.2 2398 6.2 0.22<br />
MEDIAN 1.1 0.13 2.8 500 3.6 0.10<br />
% samples over Action Level 27% 8% 0% 82% 68% 7%