Goose Creek Watershed Management Plan Version - Charlotte ...
Goose Creek Watershed Management Plan Version - Charlotte ...
Goose Creek Watershed Management Plan Version - Charlotte ...

Create successful ePaper yourself
Turn your PDF publications into a flip-book with our unique Google optimized e-Paper software.
<strong>Goose</strong> <strong>Creek</strong> <strong>Watershed</strong> <strong>Management</strong> <strong>Plan</strong> <strong>Version</strong> 1...………………...October 31, 2009<br />
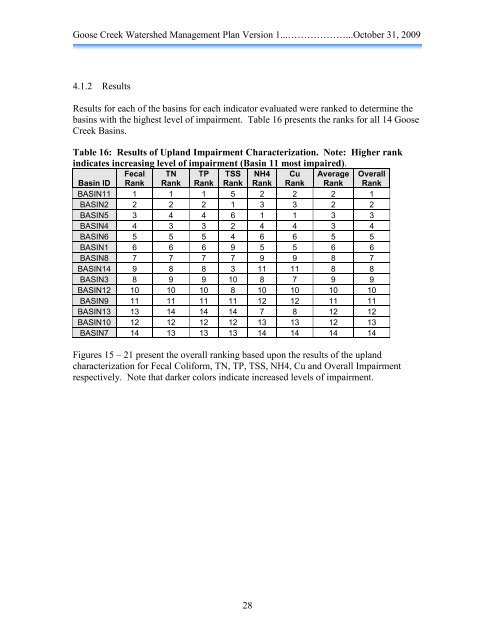
4.1.2 Results<br />
Results for each of the basins for each indicator evaluated were ranked to determine the<br />
basins with the highest level of impairment. Table 16 presents the ranks for all 14 <strong>Goose</strong><br />
<strong>Creek</strong> Basins.<br />
Table 16: Results of Upland Impairment Characterization. Note: Higher rank<br />
indicates increasing level of impairment (Basin 11 most impaired).<br />
Fecal TN TP TSS NH4 Cu Average Overall<br />
Basin ID Rank Rank Rank Rank Rank Rank Rank Rank<br />
BASIN11 1 1 1 5 2 2 2 1<br />
BASIN2 2 2 2 1 3 3 2 2<br />
BASIN5 3 4 4 6 1 1 3 3<br />
BASIN4 4 3 3 2 4 4 3 4<br />
BASIN6 5 5 5 4 6 6 5 5<br />
BASIN1 6 6 6 9 5 5 6 6<br />
BASIN8 7 7 7 7 9 9 8 7<br />
BASIN14 9 8 8 3 11 11 8 8<br />
BASIN3 8 9 9 10 8 7 9 9<br />
BASIN12 10 10 10 8 10 10 10 10<br />
BASIN9 11 11 11 11 12 12 11 11<br />
BASIN13 13 14 14 14 7 8 12 12<br />
BASIN10 12 12 12 12 13 13 12 13<br />
BASIN7 14 13 13 13 14 14 14 14<br />
Figures 15 – 21 present the overall ranking based upon the results of the upland<br />
characterization for Fecal Coliform, TN, TP, TSS, NH4, Cu and Overall Impairment<br />
respectively. Note that darker colors indicate increased levels of impairment.<br />
28