

GMSWORKS-3 Peace River Side Channel Restoration - BC Hydro
GMSWORKS-3 Peace River Side Channel Restoration - BC Hydro
GMSWORKS-3 Peace River Side Channel Restoration - BC Hydro

You also want an ePaper? Increase the reach of your titles
YUMPU automatically turns print PDFs into web optimized ePapers that Google loves.
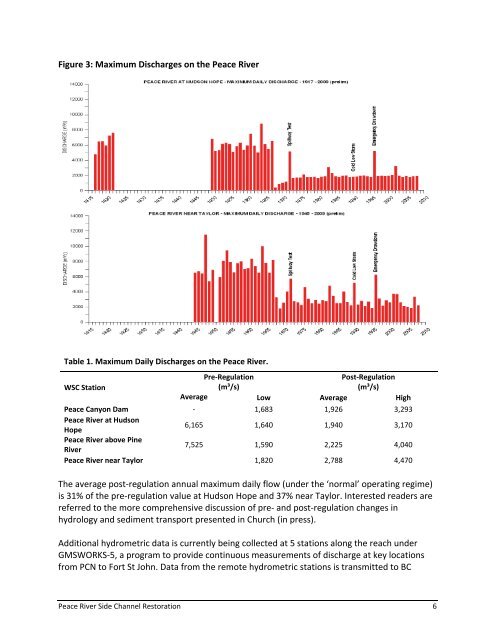
Figure 3: Maximum Discharges on the <strong>Peace</strong> <strong>River</strong><br />
Table 1. Maximum Daily Discharges on the <strong>Peace</strong> <strong>River</strong>.<br />
Pre‐Regulation<br />
Post‐Regulation<br />
WSC Station<br />
(m³/s)<br />
(m³/s)<br />
Average Low Average High<br />
<strong>Peace</strong> Canyon Dam ‐ 1,683 1,926 3,293<br />
<strong>Peace</strong> <strong>River</strong> at Hudson<br />
Hope<br />
6,165 1,640 1,940 3,170<br />
<strong>Peace</strong> <strong>River</strong> above Pine<br />
<strong>River</strong><br />
7,525 1,590 2,225 4,040<br />
<strong>Peace</strong> <strong>River</strong> near Taylor 1,820 2,788 4,470<br />
The average post‐regulation annual maximum daily flow (under the ‘normal’ operating regime)<br />
is 31% of the pre‐regulation value at Hudson Hope and 37% near Taylor. Interested readers are<br />
referred to the more comprehensive discussion of pre‐ and post‐regulation changes in<br />
hydrology and sediment transport presented in Church (in press).<br />
Additional hydrometric data is currently being collected at 5 stations along the reach under<br />
<strong>GMSWORKS</strong>‐5, a program to provide continuous measurements of discharge at key locations<br />
from PCN to Fort St John. Data from the remote hydrometric stations is transmitted to <strong>BC</strong><br />
<strong>Peace</strong> <strong>River</strong> <strong>Side</strong> <strong>Channel</strong> <strong>Restoration</strong> 6


