

Wahleach Project Water Use Plan Wahleach Reservoir ... - BC Hydro
Wahleach Project Water Use Plan Wahleach Reservoir ... - BC Hydro
Wahleach Project Water Use Plan Wahleach Reservoir ... - BC Hydro

Create successful ePaper yourself
Turn your PDF publications into a flip-book with our unique Google optimized e-Paper software.
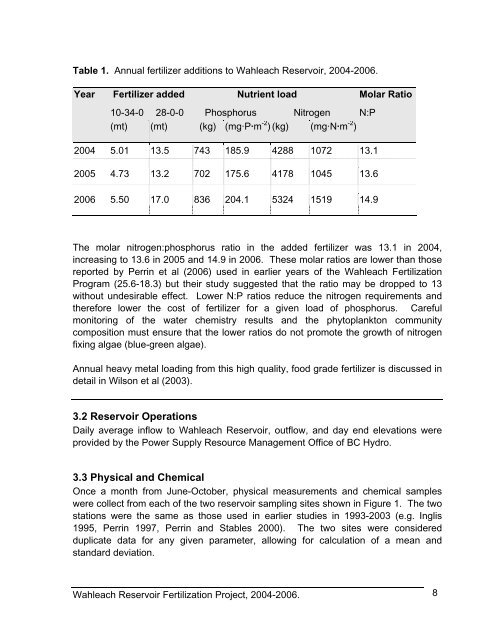
Table 1. Annual fertilizer additions to <strong>Wahleach</strong> <strong>Reservoir</strong>, 2004-2006.<br />
Year<br />
Fertilizer added Nutrient load Molar Ratio<br />
10-34-0 28-0-0 Phosphorus Nitrogen N:P<br />
(mt) (mt) (kg) (mg·P·m -2 ) (kg) (mg·N·m -2 )<br />
2004 5.01 13.5 743 185.9 4288 1072 13.1<br />
2005 4.73 13.2 702 175.6 4178 1045 13.6<br />
2006 5.50 17.0 836 204.1 5324 1519 14.9<br />
The molar nitrogen:phosphorus ratio in the added fertilizer was 13.1 in 2004,<br />
increasing to 13.6 in 2005 and 14.9 in 2006. These molar ratios are lower than those<br />
reported by Perrin et al (2006) used in earlier years of the <strong>Wahleach</strong> Fertilization<br />
Program (25.6-18.3) but their study suggested that the ratio may be dropped to 13<br />
without undesirable effect. Lower N:P ratios reduce the nitrogen requirements and<br />
therefore lower the cost of fertilizer for a given load of phosphorus. Careful<br />
monitoring of the water chemistry results and the phytoplankton community<br />
composition must ensure that the lower ratios do not promote the growth of nitrogen<br />
fixing algae (blue-green algae).<br />
Annual heavy metal loading from this high quality, food grade fertilizer is discussed in<br />
detail in Wilson et al (2003).<br />
3.2 <strong>Reservoir</strong> Operations<br />
Daily average inflow to <strong>Wahleach</strong> <strong>Reservoir</strong>, outflow, and day end elevations were<br />
provided by the Power Supply Resource Management Office of <strong>BC</strong> <strong>Hydro</strong>.<br />
3.3 Physical and Chemical<br />
Once a month from June-October, physical measurements and chemical samples<br />
were collect from each of the two reservoir sampling sites shown in Figure 1. The two<br />
stations were the same as those used in earlier studies in 1993-2003 (e.g. Inglis<br />
1995, Perrin 1997, Perrin and Stables 2000). The two sites were considered<br />
duplicate data for any given parameter, allowing for calculation of a mean and<br />
standard deviation.<br />
<strong>Wahleach</strong> <strong>Reservoir</strong> Fertilization <strong>Project</strong>, 2004-2006.<br />
8


