

Wahleach Project Water Use Plan Wahleach Reservoir ... - BC Hydro
Wahleach Project Water Use Plan Wahleach Reservoir ... - BC Hydro
Wahleach Project Water Use Plan Wahleach Reservoir ... - BC Hydro

Create successful ePaper yourself
Turn your PDF publications into a flip-book with our unique Google optimized e-Paper software.
4.3 <strong>Water</strong> Chemistry<br />
The mean pH was 7.5 in 2004, 6.6 in 2005 and 7.0 in 2005 (Table 2). The mean pH<br />
for the study period was 7.0, which was similar to previously reported values by<br />
Perrin and Stables (2000). The pH was the same for the surface and deep samples.<br />
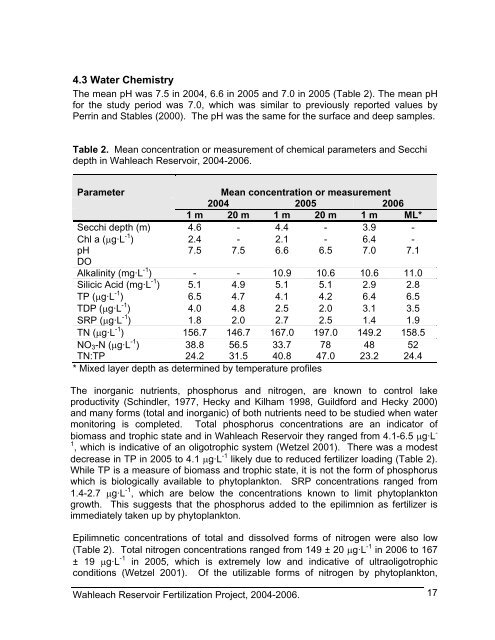
Table 2. Mean concentration or measurement of chemical parameters and Secchi<br />
depth in <strong>Wahleach</strong> <strong>Reservoir</strong>, 2004-2006.<br />
Parameter<br />
Mean concentration or measurement<br />
2004 2005 2006<br />
1 m 20 m 1 m 20 m 1 m ML*<br />
Secchi depth (m) 4.6 - 4.4 - 3.9 -<br />
Chl a (μg·L -1 ) 2.4 - 2.1 - 6.4 -<br />
pH<br />
DO<br />
7.5 7.5 6.6 6.5 7.0 7.1<br />
Alkalinity (mg·L -1 ) - - 10.9 10.6 10.6 11.0<br />
Silicic Acid (mg·L -1 ) 5.1 4.9 5.1 5.1 2.9 2.8<br />
TP (μg·L -1 ) 6.5 4.7 4.1 4.2 6.4 6.5<br />
TDP (μg·L -1 ) 4.0 4.8 2.5 2.0 3.1 3.5<br />
SRP (μg·L -1 ) 1.8 2.0 2.7 2.5 1.4 1.9<br />
TN (μg·L -1 ) 156.7 146.7 167.0 197.0 149.2 158.5<br />
NO3-N (μg·L -1 ) 38.8 56.5 33.7 78 48 52<br />
TN:TP 24.2 31.5 40.8 47.0 23.2 24.4<br />
* Mixed layer depth as determined by temperature profiles<br />
The inorganic nutrients, phosphorus and nitrogen, are known to control lake<br />
productivity (Schindler, 1977, Hecky and Kilham 1998, Guildford and Hecky 2000)<br />
and many forms (total and inorganic) of both nutrients need to be studied when water<br />
monitoring is completed. Total phosphorus concentrations are an indicator of<br />
biomass and trophic state and in <strong>Wahleach</strong> <strong>Reservoir</strong> they ranged from 4.1-6.5 μg·L -<br />
1 , which is indicative of an oligotrophic system (Wetzel 2001). There was a modest<br />
decrease in TP in 2005 to 4.1 μg·L -1 likely due to reduced fertilizer loading (Table 2).<br />
While TP is a measure of biomass and trophic state, it is not the form of phosphorus<br />
which is biologically available to phytoplankton. SRP concentrations ranged from<br />
1.4-2.7 μg·L -1 , which are below the concentrations known to limit phytoplankton<br />
growth. This suggests that the phosphorus added to the epilimnion as fertilizer is<br />
immediately taken up by phytoplankton.<br />
Epilimnetic concentrations of total and dissolved forms of nitrogen were also low<br />
(Table 2). Total nitrogen concentrations ranged from 149 ± 20 μg·L -1 in 2006 to 167<br />
± 19 μg·L -1 in 2005, which is extremely low and indicative of ultraoligotrophic<br />
conditions (Wetzel 2001). Of the utilizable forms of nitrogen by phytoplankton,<br />
<strong>Wahleach</strong> <strong>Reservoir</strong> Fertilization <strong>Project</strong>, 2004-2006.<br />
17


