

Wahleach Project Water Use Plan Wahleach Reservoir ... - BC Hydro
Wahleach Project Water Use Plan Wahleach Reservoir ... - BC Hydro
Wahleach Project Water Use Plan Wahleach Reservoir ... - BC Hydro

You also want an ePaper? Increase the reach of your titles
YUMPU automatically turns print PDFs into web optimized ePapers that Google loves.
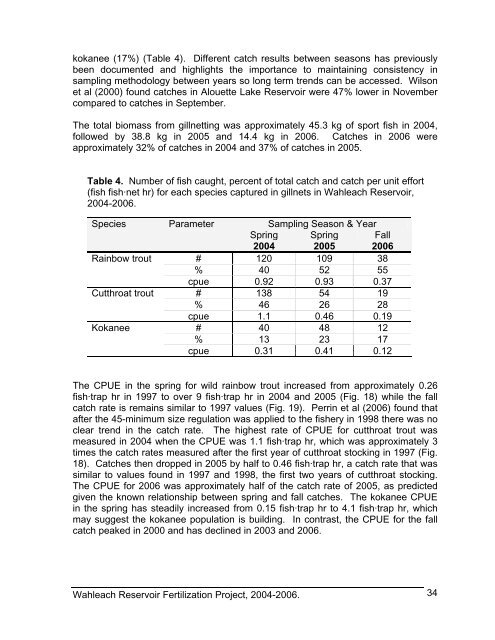
kokanee (17%) (Table 4). Different catch results between seasons has previously<br />
been documented and highlights the importance to maintaining consistency in<br />
sampling methodology between years so long term trends can be accessed. Wilson<br />
et al (2000) found catches in Alouette Lake <strong>Reservoir</strong> were 47% lower in November<br />
compared to catches in September.<br />
The total biomass from gillnetting was approximately 45.3 kg of sport fish in 2004,<br />
followed by 38.8 kg in 2005 and 14.4 kg in 2006. Catches in 2006 were<br />
approximately 32% of catches in 2004 and 37% of catches in 2005.<br />
Table 4. Number of fish caught, percent of total catch and catch per unit effort<br />
(fish fish·net hr) for each species captured in gillnets in <strong>Wahleach</strong> <strong>Reservoir</strong>,<br />
2004-2006.<br />
Species Parameter Sampling Season & Year<br />
Spring Spring Fall<br />
2004 2005 2006<br />
Rainbow trout # 120 109 38<br />
% 40 52 55<br />
cpue 0.92 0.93 0.37<br />
Cutthroat trout # 138 54 19<br />
% 46 26 28<br />
cpue 1.1 0.46 0.19<br />
Kokanee # 40 48 12<br />
% 13 23 17<br />
cpue 0.31 0.41 0.12<br />
The CPUE in the spring for wild rainbow trout increased from approximately 0.26<br />
fish·trap hr in 1997 to over 9 fish·trap hr in 2004 and 2005 (Fig. 18) while the fall<br />
catch rate is remains similar to 1997 values (Fig. 19). Perrin et al (2006) found that<br />
after the 45-minimum size regulation was applied to the fishery in 1998 there was no<br />
clear trend in the catch rate. The highest rate of CPUE for cutthroat trout was<br />
measured in 2004 when the CPUE was 1.1 fish·trap hr, which was approximately 3<br />
times the catch rates measured after the first year of cutthroat stocking in 1997 (Fig.<br />
18). Catches then dropped in 2005 by half to 0.46 fish·trap hr, a catch rate that was<br />
similar to values found in 1997 and 1998, the first two years of cutthroat stocking.<br />
The CPUE for 2006 was approximately half of the catch rate of 2005, as predicted<br />
given the known relationship between spring and fall catches. The kokanee CPUE<br />
in the spring has steadily increased from 0.15 fish·trap hr to 4.1 fish·trap hr, which<br />
may suggest the kokanee population is building. In contrast, the CPUE for the fall<br />
catch peaked in 2000 and has declined in 2003 and 2006.<br />
<strong>Wahleach</strong> <strong>Reservoir</strong> Fertilization <strong>Project</strong>, 2004-2006.<br />
34


