Strange Scholarship in the Wegman Report - Get a Free Blog
Strange Scholarship in the Wegman Report - Get a Free Blog
Strange Scholarship in the Wegman Report - Get a Free Blog

Create successful ePaper yourself
Turn your PDF publications into a flip-book with our unique Google optimized e-Paper software.
<strong>Strange</strong> <strong>Scholarship</strong> <strong>in</strong> <strong>the</strong> <strong>Wegman</strong> <strong>Report</strong> V1.0 09/26/10<br />
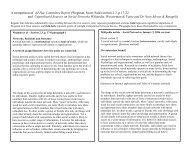
1.2 Trends – natural and human factors<br />
From [IPC2007, p.13] at right are NH temperatures relative to average<br />
temperature <strong>in</strong> 1980-1999, not immediately comparable to <strong>the</strong> previous<br />
chart (global relative to 1961-1990), but representative. Black is historical,<br />
with gray uncerta<strong>in</strong>ty range. The o<strong>the</strong>rs show projections with <strong>the</strong>ir<br />
uncerta<strong>in</strong>ty ranges for different levels of future GHG emissions chosen by<br />
humans. None of <strong>the</strong>se predict exact tracks, due to natural variability<br />
(noise). Early drafts [IPC2006] were available to <strong>the</strong> WP.<br />
Basic physics by paper-and-pencil<br />
Sunlight is absorbed by <strong>the</strong> Earth. Some is re-emitted as heat radiation.<br />
GHGs (CO2, CH4, N2O, water vapor) absorb such radiation and transfer<br />
energy to nearby molecules. Some energy is re-emitted Earthward, a good<br />
th<strong>in</strong>g as temperatures would be uncomfortably lower o<strong>the</strong>rwise. In 1896,<br />
Svante Arrhenius roughly calculated <strong>the</strong> warm<strong>in</strong>g expected from doubl<strong>in</strong>g<br />
pre-<strong>in</strong>dustrial atmospheric CO2. He was a little high, near <strong>the</strong> edge of<br />
current uncerta<strong>in</strong>ty ranges, but not far off, not bad for 1896. See Spencer<br />
Weart‘s excellent history, Theme-B❹, Theme-C❹<br />
www.aip.org/history/climate/co2.htm,<br />
Computer models help reduce uncerta<strong>in</strong>ty limits and improve<br />
regional projections, but <strong>the</strong> basics are fairly straightforward.<br />
Energy is nei<strong>the</strong>r created nor destroyed . GHGs slow emission <strong>in</strong> <strong>the</strong><br />
regions of <strong>the</strong> spectrum where GHGs absorb <strong>the</strong>rmal radiation. As GHG<br />
concentrations rise, <strong>the</strong> surface warms to ma<strong>in</strong>ta<strong>in</strong> balance between<br />
<strong>in</strong>com<strong>in</strong>g solar radiation and <strong>the</strong>rmal radiation to space. Most <strong>in</strong>com<strong>in</strong>g<br />
solar energy is first absorbed <strong>in</strong> <strong>the</strong> oceans, measured as Ocean Heat<br />
Content, which is <strong>in</strong>creas<strong>in</strong>g. Ocean oscillations cause more or less heat to<br />
be returned to <strong>the</strong> atmosphere, so El N<strong>in</strong>o years cause warmer<br />
atmospheres. Still, energy is always conserved. Unlike some areas of<br />
statistics or economics, physics has strong conservation laws, which are not<br />
mere correlations. Earth‘s energy balance does not change quickly<br />
without reasons, called forc<strong>in</strong>gs, such as changes <strong>in</strong> solar irradiance,<br />
GHGs, aerosols. Earth‘s orbital changes matter, but occur slowly.<br />
Past and future<br />
The Earth‘s future temperature track will be determ<strong>in</strong>ed by:<br />
� The current state of <strong>the</strong> Earth, especially total energy content, glacier<br />
masses, vegetation coverage and o<strong>the</strong>r factors that affect Earth‘s<br />
14<br />
overall albedo, i.e., fraction of energy reflected <strong>in</strong>to space without<br />
creat<strong>in</strong>g heat. Ice and snow reflect more than oceans.<br />
� Biological, chemical and physical processes.<br />
� Human choices, with ―public policy implications, as <strong>in</strong> [SAI2007, p.5].<br />
Difference fromNH<br />
Average 1980-1999<br />
Human emissions choices,<br />
fossil fuels, land use, etc<br />
Not at all likely.<br />
From:<br />
AR4 WG I<br />
SPM.6, p.13<br />
Future natural temperatures simply do not depend on <strong>the</strong> temperature <strong>in</strong><br />
1000AD or on our know<strong>in</strong>g anyth<strong>in</strong>g about it. <strong>Wegman</strong> even said this <strong>in</strong><br />
testimony, A.3. However, better understand<strong>in</strong>g of <strong>the</strong> past‘s natural<br />
variability helps researchers calibrate climate models, which is why<br />
researchers argue fiercely over <strong>the</strong> shape and jiggles of <strong>the</strong> shaft. If people<br />
somehow got a full set modern-grade temperature measurements from<br />
1000AD onward, noth<strong>in</strong>g would change for <strong>the</strong> future except our ability to<br />
forecast it better.<br />
The uncerta<strong>in</strong>ty limits on each emissions scenario represent huge<br />
differences of impacts and costs , so narrow<strong>in</strong>g those limits helps <strong>in</strong>form<br />
human choices.