DG-1000T - DG Flugzeugbau
DG-1000T - DG Flugzeugbau
DG-1000T - DG Flugzeugbau
You also want an ePaper? Increase the reach of your titles
YUMPU automatically turns print PDFs into web optimized ePapers that Google loves.
Flight manual <strong>DG</strong>-<strong>1000T</strong><br />
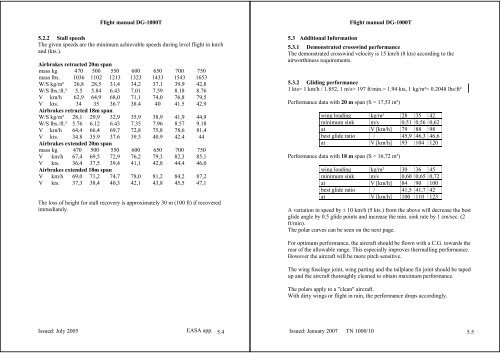
5.2.2 Stall speeds<br />
The given speeds are the minimum achievable speeds during level flight in km/h<br />
and (kts.).<br />
Airbrakes retracted 20m span<br />
mass kg 470 500 550 600 650 700 750<br />
mass lbs. 1036 1102 1213 1323 1433 1543 1653<br />
W/S kg/m² 26,8 28,5 31,4 34,2 37,1 39,9 42,8<br />
W/S lbs./ft.² 5.5 5.84 6.43 7.01 7.59 8.18 8.76<br />
V km/h 62,9 64,9 68,0 71,1 74,0 76,8 79,5<br />
V kts. 34 35 36.7 38.4 40 41.5 42.9<br />
Airbrakes retracted 18m span<br />
W/S kg/m² 28,1 29,9 32,9 35,9 38,9 41,9 44,9<br />
W/S lbs./ft.² 5.76 6.12 6.43 7.35 7.96 8.57 9.18<br />
V km/h 64,4 66,4 69,7 72,8 75,8 78,6 81,4<br />
V kts. 34.8 35.9 37.6 39.3 40.9 42.4 44<br />
Airbrakes extended 20m span<br />
mass kg 470 500 550 600 650 700 750<br />
V km/h 67,4 69,5 72,9 76,2 79,3 82,3 85,1<br />
V kts. 36,4 37,5 39,4 41,1 42,8 44,4 46,0<br />
Airbrakes extended 18m span<br />
V km/h 69,0 71,2 74,7 78,0 81,2 84,2 87,2<br />
V kts. 37,3 38,4 40,3 42,1 43,8 45,5 47,1<br />
The loss of height for stall recovery is approximately 30 m (100 ft) if recovered<br />
immediately.<br />
Issued: July 2005 EASA app. 5.4<br />
Flight manual <strong>DG</strong>-<strong>1000T</strong><br />
5.3 Additional Information<br />
5.3.1 Demonstrated crosswind performance<br />
The demonstrated crosswind velocity is 15 km/h (8 kts) according to the<br />
airworthiness requirements.<br />
5.3.2 Gliding performance<br />
1 kts= 1 km/h / 1.852, 1 m/s= 197 ft/min.= 1.94 kts, 1 kg/m²= 0.2048 lbs/ft²<br />
Performance data with 20 m span (S = 17,53 m²)<br />
wing loading kg/m² 28 35 42<br />
minimum sink m/s 0,51 0,56 0,62<br />
at V [km/h] 79 88 98<br />
best glide ratio / 45,9 46,3 46,6<br />
at V [km/h] 93 104 120<br />
Performance data with 18 m span (S = 16,72 m²)<br />
wing loading kg/m² 30 36 45<br />
minimum sink m/s 0,60 0,65 0,72<br />
at V [km/h] 84 90 100<br />
best glide ratio / 41,5 41,7 42<br />
at V [km/h] 100 110 123<br />
A variation in speed by ± 10 km/h (5 kts.) from the above will decrease the best<br />
glide angle by 0.5 glide points and increase the min. sink rate by 1 cm/sec. (2<br />
ft/min).<br />
The polar curves can be seen on the next page.<br />
For optimum performance, the aircraft should be flown with a C.G. towards the<br />
rear of the allowable range. This especially improves thermalling performance.<br />
However the aircraft will be more pitch sensitive.<br />
The wing fuselage joint, wing parting and the tailplane fin joint should be taped<br />
up and the aircraft thoroughly cleaned to obtain maximum performance.<br />
The polars apply to a "clean" aircraft.<br />
With dirty wings or flight in rain, the performance drops accordingly.<br />
Issued: January 2007 TN 1000/10 5.5


