MEDICINSKI GLASNIK
MEDICINSKI GLASNIK
MEDICINSKI GLASNIK

Create successful ePaper yourself
Turn your PDF publications into a flip-book with our unique Google optimized e-Paper software.
44<br />
Medicinski Glasnik, Volumen 9, Number 1, February 2012<br />
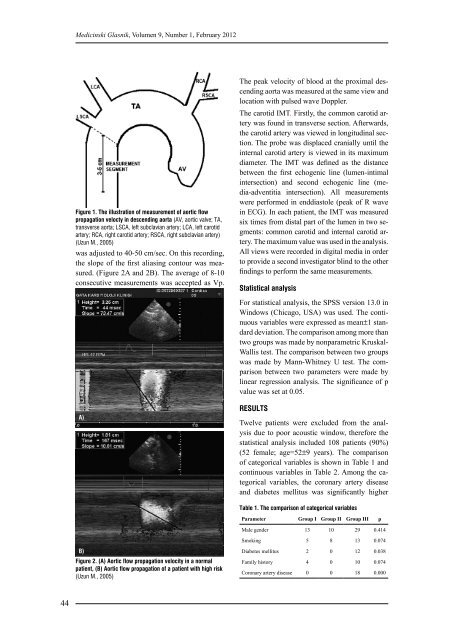
Figure 1. The illustration of measurement of aortic flow<br />
propagation velocty in descending aorta (AV, aortic valve; TA,<br />
transverse aorta; LSCA, left subclavian artery; LCA, left carotid<br />
artery; RCA, right carotid artery; RSCA, right subclavian artery)<br />
(Uzun M., 2005)<br />
was adjusted to 40-50 cm/sec. On this recording,<br />
the slope of the first aliasing contour was measured.<br />
(Figure 2A and 2B). The average of 8-10<br />
consecutive measurements was accepted as Vp.<br />
A)<br />
B)<br />
Figure 2. (A) Aortic flow propagation velocity in a normal<br />
patient, (B) Aortic flow propagation of a patient with high risk<br />
(Uzun M., 2005)<br />
The peak velocity of blood at the proximal descending<br />
aorta was measured at the same view and<br />
location with pulsed wave Doppler.<br />
The carotid IMT. Firstly, the common carotid artery<br />
was found in transverse section. Afterwards,<br />
the carotid artery was viewed in longitudinal section.<br />
The probe was displaced cranially until the<br />
internal carotid artery is viewed in its maximum<br />
diameter. The IMT was defined as the distance<br />
between the first echogenic line (lumen-intimal<br />
intersection) and second echogenic line (media-adventitia<br />
intersection). All measurements<br />
were performed in enddiastole (peak of R wave<br />
in ECG). In each patient, the IMT was measured<br />
six times from distal part of the lumen in two segments:<br />
common carotid and internal carotid artery.<br />
The maximum value was used in the analysis.<br />
All views were recorded in digital media in order<br />
to provide a second investigator blind to the other<br />
findings to perform the same measurements.<br />
Statistical analysis<br />
For statistical analysis, the SPSS version 13.0 in<br />
Windows (Chicago, USA) was used. The continuous<br />
variables were expressed as mean±1 standard<br />
deviation. The comparison among more than<br />
two groups was made by nonparametric Kruskal-<br />
Wallis test. The comparison between two groups<br />
was made by Mann-Whitney U test. The comparison<br />
between two parameters were made by<br />
linear regression analysis. The significance of p<br />
value was set at 0.05.<br />
RESULTS<br />
Twelve patients were excluded from the analysis<br />
due to poor acoustic window, therefore the<br />
statistical analysis included 108 patients (90%)<br />
(52 female; age=52±9 years). The comparison<br />
of categorical variables is shown in Table 1 and<br />
continuous variables in Table 2. Among the categorical<br />
variables, the coronary artery disease<br />
and diabetes mellitus was significantly higher<br />
Table 1. The comparison of categorical variables<br />
Parameter Group I Group II Group III p<br />
Male gender 13 10 29 0.414<br />
Smoking 5 8 13 0.074<br />
Diabetes mellitus 2 0 12 0.038<br />
Family history 4 0 10 0.074<br />
Coronary artery disease 0 0 18 0.000