Levator ani thickness variations in symptomatic and asymptomatic ...
Levator ani thickness variations in symptomatic and asymptomatic ...
Levator ani thickness variations in symptomatic and asymptomatic ...

You also want an ePaper? Increase the reach of your titles
YUMPU automatically turns print PDFs into web optimized ePapers that Google loves.
American Journal of Obstetrics <strong>and</strong> Gynecology (2004) 191, 856e61<br />
IMAGING<br />
<strong>Levator</strong> <strong>ani</strong> <strong>thickness</strong> <strong>variations</strong> <strong>in</strong> <strong>symptomatic</strong> <strong>and</strong><br />
a<strong>symptomatic</strong> women us<strong>in</strong>g magnetic resonance-based<br />
3-dimensional color mapp<strong>in</strong>g<br />
Lennox Hoyte, MD, a Marianna Jakab, MS, a Simon K. Warfield, PhD, a<br />
Susan Shott, PhD, b George Flesh, MD, a Julia R. Field<strong>in</strong>g, MD c<br />
Harvard Medical School, Boston, Mass, a Rush University, Chicago, Ill, b <strong>and</strong> University of North Carol<strong>in</strong>a at Chapel<br />
Hill, Chapel Hill, NC c<br />
Received for publication December 28, 2003; revised March 31, 2004; accepted June 21, 2004<br />
KEY WORDS<br />
<strong>Levator</strong> <strong>ani</strong><br />
Magnetic resonancebased3dimensional<br />
reconstruction<br />
Color <strong>thickness</strong><br />
mapp<strong>in</strong>g<br />
3-dimensional slicer<br />
Pelvic organ prolapse<br />
Pelvic floor<br />
dysfunction<br />
Magnetic resonance imag<strong>in</strong>g (MRI) has greatly<br />
improved our ability to study the organs <strong>and</strong> tissues of<br />
the pelvis <strong>in</strong> women. St<strong>and</strong>ard 2-dimensional MRI has<br />
been used to assess the anatomy of the female pelvic<br />
floor <strong>in</strong> cadavers <strong>and</strong> liv<strong>in</strong>g women. 1-7<br />
This research was supported by NIH P01 CA67165-06 <strong>and</strong> P41<br />
RR13218, the June Allyson Foundation <strong>and</strong> the Society of Uro-<br />
Radiology.<br />
Repr<strong>in</strong>ts are not available from the authors.<br />
0002-9378/$ - see front matter Ó 2004 Elsevier Inc. All rights reserved.<br />
doi:10.1016/j.ajog.2004.06.067<br />
www.elsevier.com/locate/ajog<br />
Objective: This study was undertaken to develop <strong>and</strong> test a 3-dimensional (3D) color <strong>thickness</strong><br />
mapp<strong>in</strong>g technique on levator <strong>ani</strong> imaged with magnetic resonance imag<strong>in</strong>g (MRI).<br />
Methods: Sup<strong>in</strong>e MRI datasets from 30 women were studied: 10 a<strong>symptomatic</strong>, 10 with<br />
urodynamic stress <strong>in</strong>cont<strong>in</strong>ence, <strong>and</strong> 10 with pelvic organ prolapse. <strong>Levator</strong>s were manually<br />
outl<strong>in</strong>ed, <strong>and</strong> <strong>thickness</strong> mapp<strong>in</strong>g applied. Three-dimensional models were colored topographically,<br />
reflect<strong>in</strong>g levator <strong>thickness</strong>. Thickness <strong>and</strong> occurrences of absent levator substance (gaps)<br />
were compared across the 3 groups, us<strong>in</strong>g nonparametric statistical tests.<br />
Results: Color <strong>thickness</strong> mapp<strong>in</strong>g was successful <strong>in</strong> all subjects. There were statistically<br />
significant differences <strong>in</strong> <strong>thickness</strong> <strong>and</strong> gap percentages among the 3 groups of women, with<br />
thicker, bulkier levators <strong>in</strong> a<strong>symptomatic</strong> women, compared with women with prolapse or<br />
urodynamic stress <strong>in</strong>cont<strong>in</strong>ence.<br />
Conclusion: Color <strong>thickness</strong> mapp<strong>in</strong>g is feasible. It may be used to compare levators <strong>in</strong><br />
<strong>symptomatic</strong> <strong>and</strong> a<strong>symptomatic</strong> women, to study relationships between levator <strong>thickness</strong> <strong>and</strong><br />
pelvic floor dysfunction. This technique can be used <strong>in</strong> larger studies for hypothesis test<strong>in</strong>g.<br />
Ó 2004 Elsevier Inc. All rights reserved.<br />
In seek<strong>in</strong>g to better underst<strong>and</strong> the specific anatomic<br />
defects that may correlate to female pelvic floor dysfunction,<br />
our group evaluated the morphology, volume, <strong>and</strong><br />
<strong>in</strong>tegrity of the levator <strong>ani</strong> <strong>and</strong> the bladder neck, us<strong>in</strong>g<br />
reconstructed 3-dimensional (3D) MR-based models <strong>in</strong><br />
liv<strong>in</strong>g women. Field<strong>in</strong>g et al 8 demonstrated the feasibility<br />
of the 3D technique <strong>and</strong> yielded early estimates of the<br />
normal range of levator volume (39 G 57 mL) <strong>in</strong> a group<br />
of 10 a<strong>symptomatic</strong> women aged 22 to 33 years. Our<br />
subsequent study used MR-based 3D reconstruction<br />
techniques to evaluate a group of 30 women, divided
Hoyte et al 857<br />
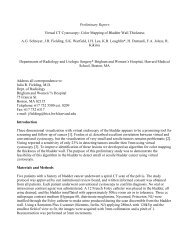
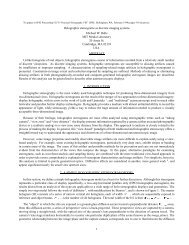
Figure 1 A reconstructed levator is shown <strong>in</strong> brown, with the<br />
symphysis (S). Views of the front, left, <strong>and</strong> right sides are<br />
shown. In the front view, the <strong>in</strong>ner layer faces the label I, <strong>and</strong><br />
the outer layer faces the label O. Additional images <strong>and</strong> video<br />
can be found onl<strong>in</strong>e at www.us.elsevierhealth.com/ajog.<br />
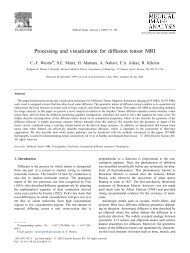
Figure 2 Three views of a color-mapped levator are shown.<br />
The color bar on the left shows the <strong>thickness</strong> (<strong>in</strong> millimeters)<br />
correspond<strong>in</strong>g to the colors seen. Additional images <strong>and</strong> video<br />
can be found onl<strong>in</strong>e at www.us.elsevierhealth.com/ajog.<br />
<strong>in</strong>to 3 groups. Ten women were a<strong>symptomatic</strong> (ASY), 10<br />
had urodynamic stress <strong>in</strong>cont<strong>in</strong>ence (USI), <strong>and</strong> the f<strong>in</strong>al<br />
10 had <strong>symptomatic</strong> pelvic organ prolapse (POP). 9 That<br />
pilot data showed significant differences <strong>in</strong> levator<br />
volume, <strong>in</strong>tegrity, <strong>and</strong> shape across the range of ASY<br />
to USI to POP, suggestive of a cont<strong>in</strong>uum of disease from<br />
ASY to USI to POP. Dur<strong>in</strong>g that study, our observations<br />
of the 3D reconstructed images suggested that levator<br />
<strong>ani</strong> <strong>thickness</strong> may be a strong marker for pelvic muscle<br />
health, but we believed that our efforts for objectively<br />
quantify<strong>in</strong>g this parameter were unsatisfactory. Therefore,<br />
we sought to develop a technique for describ<strong>in</strong>g<br />
levator muscle <strong>thickness</strong> that was visually <strong>in</strong>tuitive,<br />
mathematically consistent, <strong>and</strong> feasible for research<br />
comparison across large groups of subjects. This article<br />
presents the results of our <strong>thickness</strong> mapp<strong>in</strong>g technique,<br />
applied to evaluate <strong>and</strong> compare the <strong>thickness</strong>es of<br />
levators from the 30 subjects <strong>in</strong> our prior study. 9<br />
Material <strong>and</strong> methods<br />
This is a secondary analysis of a previously presented<br />
data set. 9 In that study, we evaluated 3 groups of women,<br />
10 ASY, 10 USI, <strong>and</strong> 10 POP, rang<strong>in</strong>g <strong>in</strong> age from 38 to<br />
78 years. Mean age <strong>in</strong> the ASY group was 51 years, with<br />
a range of 41 to 69 years. Subjects <strong>in</strong> the USI group were<br />
slightly younger, with a mean age of 48 years (range 38-<br />
56 years). The POP group was slightly older, with a mean<br />
age of 57 years (range 42-78 years). Of the 10 subjects<br />
<strong>in</strong> each group, there were 4, 6, <strong>and</strong> 6 postmenopausal<br />
women <strong>in</strong> the ASY, USI, <strong>and</strong> POP groups, respectively.<br />
Among postmenopausal subjects, hormone replacement<br />
was used by 1 <strong>in</strong> the ASY group, 2 <strong>in</strong> the USI group, <strong>and</strong><br />
1 <strong>in</strong> the POP group. If ‘‘estrogen-exposed’’ subjects are<br />
def<strong>in</strong>ed to <strong>in</strong>clude premenopausal <strong>and</strong> estrogen-us<strong>in</strong>g<br />
postmenopausal women, there were 7 estrogen-exposed<br />
women <strong>in</strong> the ASY group, 6 <strong>in</strong> the USI group, <strong>and</strong> 5 <strong>in</strong><br />
the POP group. Further details of subject selection, MR<br />
scann<strong>in</strong>g protocol, image segmentation, <strong>and</strong> 3D reconstruction<br />
techniques are further described <strong>in</strong> our previous<br />
article. 9 Our group had previously developed<br />
a technique for characteriz<strong>in</strong>g <strong>and</strong> color-cod<strong>in</strong>g bladder<br />
wall <strong>thickness</strong> from computed tomographic (CT) images<br />
<strong>in</strong> an attempt to screen for bladder tumors. 10,11 We<br />
modified this technique to measure <strong>and</strong> color code<br />
levator <strong>ani</strong> <strong>thickness</strong>.<br />
Preparation of the MR data for color<br />
<strong>thickness</strong> mapp<strong>in</strong>g<br />
<strong>Levator</strong> <strong>ani</strong> muscles on the source axial MR images<br />
are manually segmented. The ‘‘<strong>in</strong>ner’’ <strong>and</strong> ‘‘outer’’ surfaces<br />
of the levator are identified on each slice of the<br />
segmented data. The <strong>in</strong>ner surface is def<strong>in</strong>ed as that<br />
part of the levator that faces medially or superiorly <strong>in</strong><br />
situ, <strong>and</strong> the outer surface is def<strong>in</strong>ed as the part that<br />
faces laterally or <strong>in</strong>feriorly. A 3D reconstruction is then<br />
made from the segmented data. This is clarified <strong>in</strong><br />
Figure 1, where a reconstructed levator is shown with<br />
the <strong>in</strong>ner <strong>and</strong> outer surfaces labeled.<br />
Color <strong>thickness</strong> mapp<strong>in</strong>g algorithm<br />
An algorithm is applied to each po<strong>in</strong>t (P<strong>in</strong>ner) on the<br />
levator <strong>in</strong>ner surface, measur<strong>in</strong>g its distance from all<br />
po<strong>in</strong>ts on the outer surface. The distance to the closest<br />
po<strong>in</strong>t on the outer surface is taken as the <strong>thickness</strong> of the<br />
levator at po<strong>in</strong>t P<strong>in</strong>ner. After the <strong>thickness</strong> is determ<strong>in</strong>ed,<br />
each po<strong>in</strong>t (or pixel) on the reconstructed image is<br />
colored to correspond to its <strong>thickness</strong>. The range of<br />
colors used goes <strong>in</strong> the order blue, green, yellow, orange,<br />
<strong>and</strong> red, where blue is the th<strong>in</strong>nest <strong>and</strong> red is the<br />
thickest. Each levator is then <strong>in</strong>spected, <strong>and</strong> its <strong>thickness</strong><br />
at each po<strong>in</strong>t determ<strong>in</strong>ed from its color. An example of
858 Hoyte et al<br />
a color-mapped levator is given <strong>in</strong> Figure 2, along with<br />
a legend for mapp<strong>in</strong>g the colors back <strong>in</strong>to distances <strong>in</strong><br />
millimeters.<br />
Data collection <strong>and</strong> statistical analysis<br />
Each levator is then divided <strong>in</strong>to 4 quadrants, left<br />
anterior (LA), left posterior (LP), right anterior (RA),<br />
<strong>and</strong> right posterior (RP). The left-right dist<strong>in</strong>ction is<br />
made with respect to a sagittal plane runn<strong>in</strong>g through<br />
the mid-symphysis <strong>and</strong> mid-coccyx. The anterior-posterior<br />
dist<strong>in</strong>ction is made with respect to a plane parallel<br />
to the puborectalis, taken midway between the symphysis<br />
<strong>and</strong> the tip of the coccyx. Generally speak<strong>in</strong>g, the<br />
anterior divisions correspond to the puborectalis portion,<br />
<strong>and</strong> the posterior divisions correspond to the<br />
ileococcygeus portions. The maximum <strong>thickness</strong>, m<strong>in</strong>imum<br />
<strong>thickness</strong>, <strong>and</strong> presence or absence of gaps (ie,<br />
absent levator substance) is measured for each quadrant<br />
of each levator.<br />
To determ<strong>in</strong>e the <strong>thickness</strong> <strong>and</strong> gap frequencies, each<br />
quadrant of each color-mapped levator is <strong>in</strong>spected<br />
onscreen. The maximum <strong>and</strong> m<strong>in</strong>imum <strong>thickness</strong> <strong>in</strong><br />
each quadrant is determ<strong>in</strong>ed from the range of colors<br />
seen <strong>in</strong> the quadrant, <strong>and</strong> this <strong>in</strong>formation is recorded.<br />
The median <strong>thickness</strong> <strong>and</strong> range is calculated for each<br />
quadrant by study group.<br />
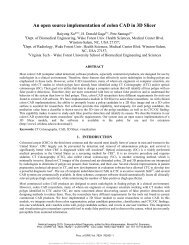
The presence or absence of ‘‘gaps’’ <strong>in</strong> the levator<br />
substance of each quadrant of each levator is determ<strong>in</strong>ed<br />
by <strong>in</strong>spection <strong>and</strong> is recorded as a ‘‘1’’ if a gap (ie,<br />
absence of levator substance) is present <strong>and</strong> a ‘‘0’’ if no<br />
gap is present <strong>in</strong> that quadrant. An example of a ‘‘gap’’<br />
<strong>in</strong> levator substance is given <strong>in</strong> Figure 3, <strong>and</strong> labeled.<br />
Gap frequency was computed <strong>and</strong> recorded for each<br />
quadrant by group.<br />
SPSS for W<strong>in</strong>dows (version 10, SPSS Inc, Chicago,<br />
Ill) was used for data management <strong>and</strong> statistical analysis.<br />
Because the noncategorical measurements had statistically<br />
non-normal distributions, the nonparametric<br />
Kruskal-Wallis test <strong>and</strong> Mann-Whitney test were used to<br />
compare the 3 groups. Fisher exact test <strong>and</strong> Fisher<br />
extended exact test were performed to compare the<br />
groups with respect to the percentage with gaps <strong>in</strong> each<br />
quadrant. A .05 significance level was used for all statistical<br />
tests. No 1-sided statistical tests were performed.<br />
Results<br />
Medians, ranges, <strong>and</strong> statistical comparisons of maximum<br />
<strong>and</strong> m<strong>in</strong>imum levator <strong>thickness</strong> for the test groups<br />
are presented <strong>in</strong> Table I for each quadrant of levator <strong>ani</strong>,<br />
across the groups. Statistical comparisons of gap frequencies<br />
for each quadrant among the 3 groups are<br />
presented <strong>in</strong> Table II. The right anterior levator was<br />
significantly thicker among ASY women when com-<br />
Figure 3 A view of gapp<strong>in</strong>g <strong>in</strong> the left side of a color-mapped<br />
levator. The gap is the area of absent levator substance seen at<br />
the po<strong>in</strong>t of the arrow. Additional images <strong>and</strong> video can be<br />
found onl<strong>in</strong>e at www.us.elsevierhealth.com/ajog.<br />
pared with women with USI or POP. The LA levator<br />
was significantly thicker <strong>in</strong> ASY women when compared<br />
with women with POP. M<strong>in</strong>imal levator <strong>thickness</strong> (ie,<br />
the th<strong>in</strong>nest part of levator <strong>ani</strong>) was greater <strong>in</strong> the RA<br />
portion <strong>in</strong> ASY women when compared with women<br />
with USI or POP. M<strong>in</strong>imal <strong>thickness</strong> was also greater <strong>in</strong><br />
the LA portions of levator <strong>in</strong> ASY women compared<br />
with women with POP. In addition, there was a lower<br />
<strong>in</strong>cidence of ‘‘gaps’’ <strong>in</strong> the levator substance on the LA<br />
levator <strong>in</strong> ASY women compared with women with USI<br />
or POP. All these differences were statistically significant.<br />
Comment<br />
These pilot study data demonstrate the usefulness of the<br />
color <strong>thickness</strong> mapp<strong>in</strong>g technique as a way to mathematically<br />
characterize <strong>and</strong> communicate <strong>in</strong>formation on<br />
levator muscle <strong>thickness</strong> <strong>in</strong> different portions of the<br />
muscle. In this experiment, the technique permitted us to<br />
easily visualize <strong>and</strong> quantify muscle <strong>thickness</strong>. On the<br />
basis of this experience, the technique appears to be<br />
suitable for review<strong>in</strong>g <strong>and</strong> compar<strong>in</strong>g large numbers of<br />
levators.<br />
The results of this study suggest that the anterior<br />
portion of the levator (ie, puborectalis) is bulkier<br />
bilaterally <strong>in</strong> ASY women compared with those with
Hoyte et al 859<br />
Table I Maximal <strong>and</strong> m<strong>in</strong>imal <strong>thickness</strong> parameters by levator quadrant <strong>in</strong> ASY vs USI <strong>and</strong> POP groups<br />
ASY USI POP<br />
Median Range<br />
P value:<br />
P value: P value:<br />
(mm) (mm) Median Range ASY vs USI Median Range ASY vs POP USI vs POP<br />
RA-max 10.01 8.6-11.35 7.33 5.33-10.01 .001 6.00 0.00-11.3 .006 NS<br />
RA-m<strong>in</strong> 4.66 2.00-7.33 3.33 0.66-3.33 .004 2.00 0.00-4.66 .013 NS<br />
RP-max 8.00 2.00-11.33 6.00 3.33-8.66 NS 4.60 2.00-10.0 NS NS<br />
RP-m<strong>in</strong> 2.00 0.66-4.66 2.67 0.66-3.33 NS 1.33 0.66-3.33 NS NS<br />
LA-max 11.35 10.01-11.35 11.33 7.33-11.35 NS 7.33 3.33-11.35 .003 .022<br />
LA-m<strong>in</strong> 4.66 2.00-7.33 3.33 2.00-4.66 .074 2.00 0.66-4.66 .007 .07<br />
LP-max 7.33 4.66-11.35 8.66 6.00-11.35 NS 6.00 2.00-11.35 .059 .027<br />
LP-m<strong>in</strong> 2.00 0.66-4.66 2.00 0.66-3.33 NS 2.00 0.66-3.33 NS NS<br />
RA-max, Maximal right anterior levator <strong>thickness</strong>; RA-m<strong>in</strong>, m<strong>in</strong>imal right anterior levator <strong>thickness</strong>; RP-max, m<strong>in</strong>, right posterior levator maximal <strong>and</strong><br />
m<strong>in</strong>imal <strong>thickness</strong>; LA-max, m<strong>in</strong>, left anterior maximal <strong>and</strong> m<strong>in</strong>imal <strong>thickness</strong>; LP-max, m<strong>in</strong>, left posterior levator maximal <strong>and</strong> m<strong>in</strong>imal <strong>thickness</strong>; NS, not<br />
significant.<br />
Table II <strong>Levator</strong> gap frequency by quadrant <strong>in</strong> ASY vs women<br />
with USI <strong>and</strong> POP<br />
ASY<br />
%Gaps<br />
USI<br />
%Gaps<br />
POP<br />
%Gaps<br />
ASY vs<br />
USI<br />
P value<br />
ASY vs<br />
POP<br />
P value<br />
RA 30 60 80 NS NS NS<br />
RP 80 90 90 NS NS NS<br />
LA 10 80 100 .005 .0005 NS<br />
LP 90 90 100 NS NS NS<br />
USI vs<br />
POP<br />
P value<br />
POP, <strong>and</strong> bulkier on the right <strong>in</strong> ASY women<br />
compared with women with USI. On the left, significant<br />
<strong>in</strong>creases <strong>in</strong> loss of levator substance are noted <strong>in</strong><br />
the anterior portions of the levators <strong>in</strong> women with<br />
POP <strong>and</strong> USI, compared with ASY women. This<br />
f<strong>in</strong>d<strong>in</strong>g is also suggestive of decreased bulk <strong>in</strong> the<br />
<strong>symptomatic</strong> groups. Possible explanations for these<br />
f<strong>in</strong>d<strong>in</strong>gs <strong>in</strong>clude muscle atrophy caused by denervation<br />
from childbirth <strong>in</strong>juries, or perhaps muscle wast<strong>in</strong>g<br />
caused by the loss of <strong>in</strong>sertion po<strong>in</strong>ts for the puborectalis,<br />
also stemm<strong>in</strong>g possibly from childbirth <strong>in</strong>jury,<br />
as has been suggested by the results of Delancey et al. 12<br />
It is also possible that these may be normal <strong>variations</strong><br />
<strong>in</strong> muscle parameters, as was seen by Tunn et al 7 when<br />
they evaluated levator geometry <strong>in</strong> a group of nulliparous<br />
women.<br />
Because striated muscle atrophies with age, <strong>and</strong><br />
estrogen receptors have been detected <strong>in</strong> levator muscle<br />
stroma <strong>and</strong> fascia, 13 it is reasonable to expect that<br />
levator muscle bulk, <strong>and</strong> thus <strong>thickness</strong>, is likely to<br />
decrease with age, <strong>and</strong> possibly also with estrogen<br />
status. Age <strong>and</strong> hormonal status therefore represent<br />
confound<strong>in</strong>g factors <strong>in</strong> our analysis. There was considerable<br />
age overlap among the groups, but the USI group<br />
was the youngest, followed by the ASY <strong>and</strong> POP<br />
groups, respectively. On the basis of these age distribu-<br />
tions, it is possible that age-related muscle atrophy could<br />
help to account for the differences <strong>in</strong> <strong>thickness</strong> <strong>and</strong><br />
‘‘gapp<strong>in</strong>g’’ between the ASY <strong>and</strong> POP (or USI <strong>and</strong> POP)<br />
groups, but not between the ASY <strong>and</strong> USI groups.<br />
Regard<strong>in</strong>g hormonal status, there were 7 estrogenexposed<br />
women <strong>in</strong> the ASY group, 6 <strong>in</strong> the USI group,<br />
<strong>and</strong> 5 <strong>in</strong> the POP group. It is possible that hormonal<br />
status might <strong>in</strong>fluence the comparison between the ASY<br />
<strong>and</strong> POP (or USI <strong>and</strong> POP) groups, but less so the<br />
comparison between ASY <strong>and</strong> USI groups. However,<br />
these relationships are best explored by a larger welldesigned<br />
study.<br />
In either case, a reduction <strong>in</strong> puborectalis bulk is<br />
noted <strong>in</strong> women with USI or POP, when compared with<br />
ASY women. The cl<strong>in</strong>ical significance of this f<strong>in</strong>d<strong>in</strong>g<br />
rema<strong>in</strong>s to be clarified <strong>in</strong> larger studies.<br />
In a multicenter study, Swift et al 14 found stage II<br />
POP <strong>in</strong> 32% of women present<strong>in</strong>g to general gynecology<br />
cl<strong>in</strong>ics. Their results were not generalizable to the<br />
US population because of the racial <strong>and</strong> socioeconomic<br />
composition of the study population. Still, it is probably<br />
reasonable to expect a proportion of subjects with<br />
stage II POP among our ASY group. If POP is<br />
associated with a lower muscle bulk, then mean muscle<br />
<strong>thickness</strong> <strong>in</strong> our ASY group would be pulled lower by<br />
those ASY women with undiagnosed POP, <strong>and</strong> this<br />
would tend to narrow the differences among the study<br />
groups. If these ‘‘occult’’ POP subjects were excluded<br />
from the ASY group, the overall <strong>thickness</strong> <strong>and</strong> bulk of<br />
the levators <strong>in</strong> this group would be expected to <strong>in</strong>crease,<br />
strengthen<strong>in</strong>g the differences amon the groups.<br />
This po<strong>in</strong>t re<strong>in</strong>forces the need for objective subject<br />
characterization.<br />
Regard<strong>in</strong>g the gaps <strong>in</strong> the levator muscle substance,<br />
the well-known chemical shift phenomenon can, by<br />
artifact, ‘‘th<strong>in</strong> out’’ the muscle signal on MRI, depend<strong>in</strong>g<br />
on the encod<strong>in</strong>g direction of the MR scan, <strong>and</strong> the<br />
spatial relationship of muscle to fatty tissue. For this
860 Hoyte et al<br />
reason, one side (right) of the levator muscle tended to<br />
appear th<strong>in</strong>ner on the MRI than the other side (left).<br />
Thickness comparisons between left <strong>and</strong> right sides were<br />
not attempted because of this artifact. The artifact<strong>in</strong>duced<br />
preferential th<strong>in</strong>n<strong>in</strong>g on the right should have<br />
led to more ‘‘gaps’’ on the right, <strong>in</strong> places where the muscle<br />
was truly th<strong>in</strong> to beg<strong>in</strong> with. However, more gaps<br />
were seen on the left, where the muscle was thicker.<br />
This f<strong>in</strong>d<strong>in</strong>g suggests that the ‘‘gaps’’ seen on the left<br />
represent a true f<strong>in</strong>d<strong>in</strong>g, unrelated to artifact. These gaps<br />
may represent fibrosis or fatty <strong>in</strong>filtration of the muscle,<br />
<strong>and</strong> rema<strong>in</strong> to be elucidated.<br />
The important topic of <strong>in</strong>terobserver <strong>and</strong> <strong>in</strong>traobserver<br />
measurement variability was addressed <strong>in</strong> the<br />
orig<strong>in</strong>al manuscript, cover<strong>in</strong>g the manual segmentation<br />
used to calculate levator volume. 9 As noted there, the<br />
<strong>in</strong>terobserver bias was 1.17 mL, with limits of agreement<br />
at G4.52 mL, <strong>and</strong> the <strong>in</strong>traobserver bias was<br />
ÿ0.26 mL, <strong>and</strong> limits of agreement were G3.4 mL.<br />
However, one could obta<strong>in</strong> identical volume measurements<br />
from 2 different segmentation geometries. Consequently,<br />
an appropriate reliability analysis needs to<br />
consider the spatial overlap of the segmentations as well<br />
as the actual numeric results (eg, volume or <strong>thickness</strong>).<br />
That type of analysis was not available when we did<br />
the current study, <strong>and</strong> is not <strong>in</strong>cluded here. S<strong>in</strong>ce then,<br />
a suitable reliability technique has been developed by<br />
our colleagues at the Surgical Plann<strong>in</strong>g Laboratory, 15<br />
<strong>and</strong> we look forward to test<strong>in</strong>g it on our datasets.<br />
The current 3D <strong>thickness</strong> analysis is more accurate<br />
than a straight 2D analysis. This is true because a s<strong>in</strong>gle<br />
slice <strong>thickness</strong> measurement only considers adjacent<br />
po<strong>in</strong>ts with<strong>in</strong> the plane of the slice, whereas the 3D<br />
analysis also considers adjacent po<strong>in</strong>ts outside of the<br />
slice plane. Furthermore, <strong>variations</strong> <strong>in</strong> the MR slice<br />
acquisition angle can <strong>in</strong>troduce artifacts that alter the<br />
<strong>thickness</strong> of the item under study. 16 These artifacts are<br />
not present <strong>in</strong> the 3D <strong>thickness</strong> analysis. The 3D visual<br />
render<strong>in</strong>gs allow an observer to quickly localize <strong>and</strong><br />
compare <strong>thickness</strong>es across large numbers of levators,<br />
<strong>and</strong> this capability is not readily available <strong>in</strong> slice-byslice<br />
<strong>thickness</strong> analysis. In addition, a full mathematical<br />
description of the <strong>thickness</strong> at each po<strong>in</strong>t on the surface<br />
is reta<strong>in</strong>ed as part of the geometric description of the<br />
color-mapped levator. Future algorithms can analyze<br />
<strong>and</strong> compare such descriptions across groups of <strong>in</strong>terest.<br />
Our study has some limitations, <strong>and</strong> we plan to<br />
remedy these <strong>in</strong> future work. First, our characterization<br />
of our subjects was limited to urodynamic test<strong>in</strong>g <strong>and</strong><br />
prolapse stag<strong>in</strong>g <strong>in</strong> the <strong>symptomatic</strong> groups only. In<br />
future studies we plan to <strong>in</strong>clude a validated symptom<br />
questionnaire, cough stress <strong>and</strong> urodynamic test<strong>in</strong>g, <strong>and</strong><br />
POPQ stag<strong>in</strong>g <strong>in</strong> all of our study subjects. F<strong>in</strong>ally, the<br />
color-map analysis is limited by the speed of segmentation.<br />
With the use of the manual technique, segmenta-<br />
tions can proceed at the rate of under 1 person-hour per<br />
dataset. This works out to about 2000 datasets per<br />
person-year, assum<strong>in</strong>g 40-hour work week. We are<br />
currently evaluat<strong>in</strong>g methods for shorten<strong>in</strong>g the time<br />
required to process each dataset. Despite these limitations,<br />
our f<strong>in</strong>d<strong>in</strong>gs are potentially cl<strong>in</strong>ically relevant <strong>and</strong><br />
we plan to cont<strong>in</strong>ue this work <strong>in</strong> larger studies <strong>in</strong> the<br />
future.<br />
Acknowledgments<br />
We acknowledge the contributions of Dr Lore Schierlitz,<br />
who helped to prepare the raw MR data for color<br />
<strong>thickness</strong> analysis.<br />
References<br />
1. Strohbehn K, Ellis J, Strohbehn JA, Delancey JOL. Magnetic<br />
resonance imag<strong>in</strong>g of the levator <strong>ani</strong> with anatomic correlation.<br />
Obstet Gynecol 1996;87:277-85.<br />
2. Huddleston HT, Dunnihoo DT, Huddleston PM 3d, Meyers PC.<br />
Magnetic resonance imag<strong>in</strong>g of defects <strong>in</strong> DeLancey’s support<br />
levels I, II, <strong>and</strong> III. Am J Obstet Gynecol 1995;172:1778-84.<br />
3. Kirshner-Hermanns R, We<strong>in</strong> B, Niehaus S, Schaeffer W, Jakse G.<br />
The contribution of magnetic resonance imag<strong>in</strong>g of the pelvic<br />
floor to the underst<strong>and</strong><strong>in</strong>g of ur<strong>in</strong>ary <strong>in</strong>cont<strong>in</strong>ence. Br J Urol<br />
1993;72:715-8.<br />
4. Healy JC, Halligan S, Reznek RH, Watson S, Phillips RKS,<br />
Armstrong P. Patterns of prolapse <strong>in</strong> women with symptoms of<br />
pelvic floor weakness: assessment of MR imag<strong>in</strong>g. Radiol<br />
1997;203:77-81.<br />
5. Field<strong>in</strong>g JR, Versi E, Mulkern RV, Lerner MH, Griffiths DJ,<br />
Jolesz FA. MR imag<strong>in</strong>g of the female pelvic floor <strong>in</strong> the sup<strong>in</strong>e <strong>and</strong><br />
upright positions. J Magn Reson Imag<strong>in</strong>g 1996;6:961-3.<br />
6. Tunn R, Delancey JOL, Qu<strong>in</strong>t LE. Visibility of pelvic organ<br />
support system structures <strong>in</strong> magnetic resonance images without<br />
an endovag<strong>in</strong>al coil. Am J Obstet Gynecol 2001;184:1156-63.<br />
7. Tunn R, Delancey JOL, Howard D, Ashton-Miller J, Qu<strong>in</strong>t LE.<br />
Anatomic <strong>variations</strong> <strong>in</strong> the levator <strong>ani</strong> muscle, endopelvic fascia,<br />
<strong>and</strong> urethra <strong>in</strong> nulliparas evaluated by magnetic resonance<br />
imag<strong>in</strong>g. Am J Obstet Gynecol 2003;188:116-21.<br />
8. Field<strong>in</strong>g JR, Dumanli H, Schreyer A, Okuda S, Ger<strong>in</strong>g D, Zou K,<br />
et al. MR-based three-dimensional model<strong>in</strong>g of the normal pelvic<br />
floor <strong>in</strong> women: quantification of muscle mass. Am J Radiol<br />
2000;174:657-60.<br />
9. Hoyte L, Schierlitz L, Zou K, Flesh G, Field<strong>in</strong>g JR. Two- <strong>and</strong> 3dimensional<br />
MRI comparison of levator <strong>ani</strong> structure, volume <strong>and</strong><br />
<strong>in</strong>tegrity <strong>in</strong> women with stress <strong>in</strong>cont<strong>in</strong>ence <strong>and</strong> prolapse. Am J<br />
Obstet Gynecol 2001;185:11-9.<br />
10. Jaume S, Ferrant M, Macq B, Hoyte L, Field<strong>in</strong>g JR, Schreyer A,<br />
et al. Tumor detection <strong>in</strong> the bladder wall with a measurement<br />
of abnormal <strong>thickness</strong> <strong>in</strong> CT scans. IEEE Trans Biomed Eng<br />
2003;50:383-90.<br />
11. Field<strong>in</strong>g JR, Hoyte L, Okon SA, Schreyer A, Lee J, Zou KH, et al.<br />
Tumor detection by virtual cystoscopy with color mapp<strong>in</strong>g of<br />
bladder wall <strong>thickness</strong>. J Urol 2002;167:559-62.<br />
12. DeLancey JOL, Kearney R, Chou Q, Speights S, B<strong>in</strong>no S. The<br />
appearance of levator <strong>ani</strong> muscle abnormalities <strong>in</strong> magnetic<br />
resonance images after vag<strong>in</strong>al delivery. Obstet Gynecol<br />
2003;101:46-53.<br />
13. Copas P, Bukovsky A, Asbury B, Elder RF, Caudle MR.<br />
Estrogen, progesterone, <strong>and</strong> <strong>and</strong>rogen receptor expression <strong>in</strong>
Hoyte et al 861<br />
levator <strong>ani</strong> muscle <strong>and</strong> fascia. J Womens Health (Larchmt)<br />
2001;10:785-95.<br />
14. Swift SE, Schaffer J, Bl<strong>and</strong> D, O’Boyle A, Woodman P, Valley M,<br />
et al. Pelvic organ support study (POSST): distribution of pelvic<br />
organ support stages by POPQ <strong>in</strong> a general gynecologic population.<br />
Pelvic Med Surg 2003;9:207.<br />
15. Warfield SK, Zou KH, Wells WM. Simultaneous truth <strong>and</strong> performance<br />
level estimation (STAPLE): an algorithm for the validation<br />
of image segmentation. IEEE Trans Med Imag 2004;23:903-21.<br />
16. Hoyte L, Ratiu P. L<strong>in</strong>ear measurements <strong>in</strong> 2-dimensional pelvic<br />
floor imag<strong>in</strong>g: the impact of slice tilt angles on measurement<br />
reproducibility. Am J Obstet Gynecol 2001;185:537-44.