Download the report - Vodafone
Download the report - Vodafone
Download the report - Vodafone

Create successful ePaper yourself
Turn your PDF publications into a flip-book with our unique Google optimized e-Paper software.
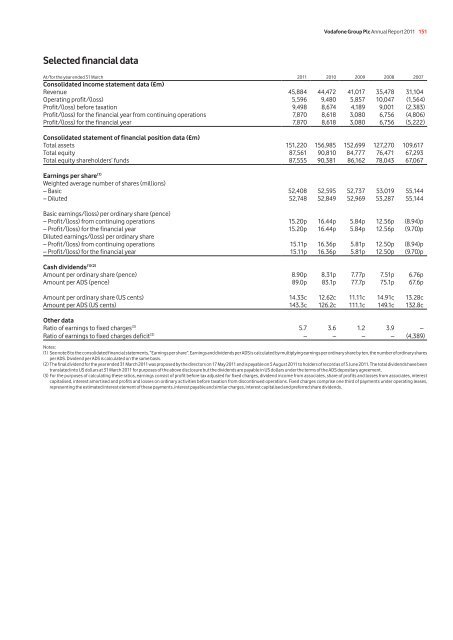
Selected financial data<br />
<strong>Vodafone</strong> Group Plc Annual Report 2011 151<br />
At/for <strong>the</strong> year ended 31 March 2011 2010 2009 2008 2007<br />
Consolidated income statement data (£m)<br />
Revenue 45,884 44,472 41,017 35,478 31,104<br />
Operating profit/(loss) 5,596 9,480 5,857 10,047 (1,564)<br />
Profit/(loss) before taxation 9,498 8,674 4,189 9,001 (2,383)<br />
Profit/(loss) for <strong>the</strong> financial year from continuing operations 7,870 8,618 3,080 6,756 (4,806)<br />
Profit/(loss) for <strong>the</strong> financial year 7,870 8,618 3,080 6,756 (5,222)<br />
Consolidated statement of financial position data (£m)<br />
Total assets 151,220 156,985 152,699 127,270 109,617<br />
Total equity 87,561 90,810 84,777 76,471 67,293<br />
Total equity shareholders’ funds 87,555 90,381 86,162 78,043 67,067<br />
Earnings per share (1)<br />
Weighted average number of shares (millions)<br />
– Basic 52,408 52,595 52,737 53,019 55,144<br />
– Diluted 52,748 52,849 52,969 53,287 55,144<br />
Basic earnings/(loss) per ordinary share (pence)<br />
– Profit/(loss) from continuing operations 15.20p 16.44p 5.84p 12.56p (8.94)p<br />
– Profit/(loss) for <strong>the</strong> financial year 15.20p 16.44p 5.84p 12.56p (9.70)p<br />
Diluted earnings/(loss) per ordinary share<br />
– Profit/(loss) from continuing operations 15.11p 16.36p 5.81p 12.50p (8.94)p<br />
– Profit/(loss) for <strong>the</strong> financial year 15.11p 16.36p 5.81p 12.50p (9.70)p<br />
Cash dividends (1)(2)<br />
Amount per ordinary share (pence) 8.90p 8.31p 7.77p 7.51p 6.76p<br />
Amount per ADS (pence) 89.0p 83.1p 77.7p 75.1p 67.6p<br />
Amount per ordinary share (US cents) 14.33c 12.62c 11.11c 14.91c 13.28c<br />
Amount per ADS (US cents) 143.3c 126.2c 111.1c 149.1c 132.8c<br />
O<strong>the</strong>r data<br />
Ratio of earnings to fixed charges (3) 5.7 3.6 1.2 3.9 –<br />
Ratio of earnings to fixed charges deficit (3) – – – – (4,389)<br />
Notes:<br />
(1) See note 8 to <strong>the</strong> consolidated financial statements, “Earnings per share”. Earnings and dividends per ADS is calculated by multiplying earnings per ordinary share by ten, <strong>the</strong> number of ordinary shares<br />
per ADS. Dividend per ADS is calculated on <strong>the</strong> same basis.<br />
(2) The final dividend for <strong>the</strong> year ended 31 March 2011 was proposed by <strong>the</strong> directors on 17 May 2011 and is payable on 5 August 2011 to holders of record as of 3 June 2011. The total dividends have been<br />
translated into US dollars at 31 March 2011 for purposes of <strong>the</strong> above disclosure but <strong>the</strong> dividends are payable in US dollars under <strong>the</strong> terms of <strong>the</strong> ADS depositary agreement.<br />
(3) For <strong>the</strong> purposes of calculating <strong>the</strong>se ratios, earnings consist of profit before tax adjusted for fixed charges, dividend income from associates, share of profits and losses from associates, interest<br />
capitalised, interest amortised and profits and losses on ordinary activities before taxation from discontinued operations. Fixed charges comprise one third of payments under operating leases,<br />
representing <strong>the</strong> estimated interest element of <strong>the</strong>se payments, interest payable and similar charges, interest capitalised and preferred share dividends.