Download the report - Vodafone
Download the report - Vodafone
Download the report - Vodafone

Create successful ePaper yourself
Turn your PDF publications into a flip-book with our unique Google optimized e-Paper software.
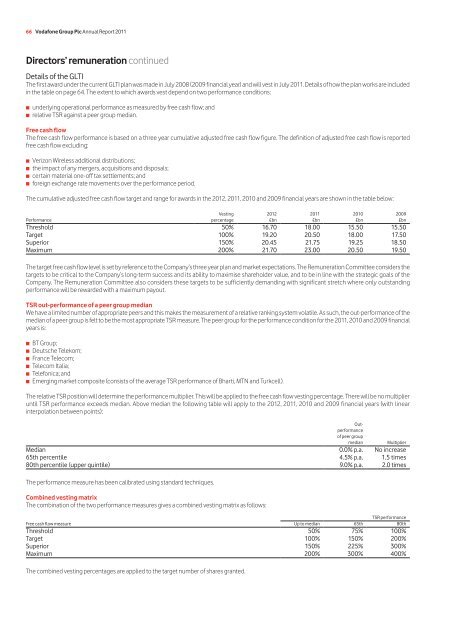
66 <strong>Vodafone</strong> Group Plc Annual Report 2011<br />
Directors’ remuneration continued<br />
Details of <strong>the</strong> GLTI<br />
The first award under <strong>the</strong> current GLTI plan was made in July 2008 (2009 financial year) and will vest in July 2011. Details of how <strong>the</strong> plan works are included<br />
in <strong>the</strong> table on page 64. The extent to which awards vest depend on two performance conditions:<br />
■■ underlying operational performance as measured by free cash flow; and<br />
■■ relative TSR against a peer group median.<br />
Free cash flow<br />
The free cash flow performance is based on a three year cumulative adjusted free cash flow figure. The definition of adjusted free cash flow is <strong>report</strong>ed<br />
free cash flow excluding:<br />
■■ Verizon Wireless additional distributions;<br />
■■ <strong>the</strong> impact of any mergers, acquisitions and disposals;<br />
■■ certain material one-off tax settlements; and<br />
■■ foreign exchange rate movements over <strong>the</strong> performance period.<br />
The cumulative adjusted free cash flow target and range for awards in <strong>the</strong> 2012, 2011, 2010 and 2009 financial years are shown in <strong>the</strong> table below:<br />
Performance<br />
Vesting<br />
percentage<br />
Threshold 50% 16.70 18.00 15.50 15.50<br />
Target 100% 19.20 20.50 18.00 17.50<br />
Superior 150% 20.45 21.75 19.25 18.50<br />
Maximum 200% 21.70 23.00 20.50 19.50<br />
The target free cash flow level is set by reference to <strong>the</strong> Company’s three year plan and market expectations. The Remuneration Committee considers <strong>the</strong><br />
targets to be critical to <strong>the</strong> Company’s long-term success and its ability to maximise shareholder value, and to be in line with <strong>the</strong> strategic goals of <strong>the</strong><br />
Company. The Remuneration Committee also considers <strong>the</strong>se targets to be sufficiently demanding with significant stretch where only outstanding<br />
performance will be rewarded with a maximum payout.<br />
TSR out-performance of a peer group median<br />
We have a limited number of appropriate peers and this makes <strong>the</strong> measurement of a relative ranking system volatile. As such, <strong>the</strong> out-performance of <strong>the</strong><br />
median of a peer group is felt to be <strong>the</strong> most appropriate TSR measure. The peer group for <strong>the</strong> performance condition for <strong>the</strong> 2011, 2010 and 2009 financial<br />
years is:<br />
■■ BT Group;<br />
■■ Deutsche Telekom;<br />
■■ France Telecom;<br />
■■ Telecom Italia;<br />
■■ Telefonica; and<br />
■■ Emerging market composite (consists of <strong>the</strong> average TSR performance of Bharti, MTN and Turkcell).<br />
The relative TSR position will determine <strong>the</strong> performance multiplier. This will be applied to <strong>the</strong> free cash flow vesting percentage. There will be no multiplier<br />
until TSR performance exceeds median. Above median <strong>the</strong> following table will apply to <strong>the</strong> 2012, 2011, 2010 and 2009 financial years (with linear<br />
interpolation between points):<br />
Out-<br />
performance<br />
of peer group<br />
median Multiplier<br />
Median 0.0% p.a. No increase<br />
65th percentile 4.5% p.a. 1.5 times<br />
80th percentile (upper quintile) 9.0% p.a. 2.0 times<br />
The performance measure has been calibrated using standard techniques.<br />
Combined vesting matrix<br />
The combination of <strong>the</strong> two performance measures gives a combined vesting matrix as follows:<br />
TSR performance<br />
Free cash flow measure Up to median 65th 80th<br />
Threshold 50% 75% 100%<br />
Target 100% 150% 200%<br />
Superior 150% 225% 300%<br />
Maximum 200% 300% 400%<br />
The combined vesting percentages are applied to <strong>the</strong> target number of shares granted.<br />
2012<br />
£bn<br />
2011<br />
£bn<br />
2010<br />
£bn<br />
2009<br />
£bn