Download the report - Vodafone
Download the report - Vodafone
Download the report - Vodafone

You also want an ePaper? Increase the reach of your titles
YUMPU automatically turns print PDFs into web optimized ePapers that Google loves.
82 <strong>Vodafone</strong> Group Plc Annual Report 2011<br />
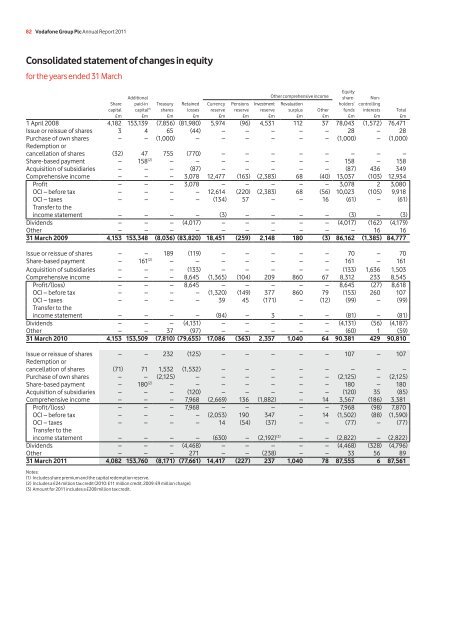
Consolidated statement of changes in equity<br />
for <strong>the</strong> years ended 31 March<br />
Equity<br />
Additional O<strong>the</strong>r comprehensive income share- Non-<br />
Share paid-in Treasury Retained Currency Pensions Investment Revaluation holders’ controlling<br />
capital capital (1) shares losses reserve reserve reserve surplus O<strong>the</strong>r funds interests Total<br />
£m £m £m £m £m £m £m £m £m £m £m £m<br />
1 April 2008 4,182 153,139 (7,856) (81,980) 5,974 (96) 4,531 112 37 78,043 (1,572) 76,471<br />
Issue or reissue of shares 3 4 65 (44) – – – – – 28 – 28<br />
Purchase of own shares – – (1,000) – – – – – – (1,000) – (1,000)<br />
Redemption or<br />
cancellation of shares (32) 47 755 (770) – – – – – – – –<br />
Share-based payment – 158 (2) – – – – – – – 158 – 158<br />
Acquisition of subsidiaries – – – (87) – – – – – (87) 436 349<br />
Comprehensive income – – – 3,078 12,477 (163) (2,383) 68 (40) 13,037 (103) 12,934<br />
Profit – – – 3,078 – – – – – 3,078 2 3,080<br />
OCI – before tax – – – – 12,614 (220) (2,383) 68 (56) 10,023 (105) 9,918<br />
OCI – taxes – – – – (134) 57 – – 16 (61) – (61)<br />
Transfer to <strong>the</strong><br />
income statement – – – – (3) – – – – (3) – (3)<br />
Dividends – – – (4,017) – – – – – (4,017) (162) (4,179)<br />
O<strong>the</strong>r – – – – – – – – – – 16 16<br />
31 March 2009 4,153 153,348 (8,036) (83,820) 18,451 (259) 2,148 180 (3) 86,162 (1,385) 84,777<br />
Issue or reissue of shares – – 189 (119) – – – – – 70 – 70<br />
Share-based payment – 161 (2) – – – – – – – 161 – 161<br />
Acquisition of subsidiaries – – – (133) – – – – – (133) 1,636 1,503<br />
Comprehensive income – – – 8,645 (1,365) (104) 209 860 67 8,312 233 8,545<br />
Profit/(loss) – – – 8,645 – – – – – 8,645 (27) 8,618<br />
OCI – before tax – – – – (1,320) (149) 377 860 79 (153) 260 107<br />
OCI – taxes – – – – 39 45 (171) – (12) (99) – (99)<br />
Transfer to <strong>the</strong><br />
income statement – – – – (84) – 3 – – (81) – (81)<br />
Dividends – – – (4,131) – – – – – (4,131) (56) (4,187)<br />
O<strong>the</strong>r – – 37 (97) – – – – – (60) 1 (59)<br />
31 March 2010 4,153 153,509 (7,810) (79,655) 17,086 (363) 2,357 1,040 64 90,381 429 90,810<br />
Issue or reissue of shares – – 232 (125) – – – – – 107 – 107<br />
Redemption or<br />
cancellation of shares (71) 71 1,532 (1,532) – – – – – – – –<br />
Purchase of own shares – – (2,125) – – – – – – (2,125) – (2,125)<br />
Share-based payment – 180 (2) – – – – – – – 180 – 180<br />
Acquisition of subsidiaries – – – (120) – – – – – (120) 35 (85)<br />
Comprehensive income – – – 7,968 (2,669) 136 (1,882) – 14 3,567 (186) 3,381<br />
Profit/(loss) – – – 7,968 – – – – – 7,968 (98) 7,870<br />
OCI – before tax – – – – (2,053) 190 347 – 14 (1,502) (88) (1,590)<br />
OCI – taxes – – – – 14 (54) (37) – – (77) – (77)<br />
Transfer to <strong>the</strong><br />
income statement – – – – (630) – (2,192) (3) – – (2,822) – (2,822)<br />
Dividends – – – (4,468) – – – – – (4,468) (328) (4,796)<br />
O<strong>the</strong>r – – – 271 – – (238) – – 33 56 89<br />
31 March 2011 4,082 153,760 (8,171) (77,661) 14,417 (227) 237 1,040 78 87,555 6 87,561<br />
Notes:<br />
(1) Includes share premium and <strong>the</strong> capital redemption reserve.<br />
(2) Includes a £24 million tax credit (2010: £11 million credit, 2009: £9 million charge).<br />
(3) Amount for 2011 includes a £208 million tax credit.