

3 - World Journal of Gastroenterology
3 - World Journal of Gastroenterology
3 - World Journal of Gastroenterology

Create successful ePaper yourself
Turn your PDF publications into a flip-book with our unique Google optimized e-Paper software.
A<br />
B<br />
Sun Y et al . Terahertz pulsed imaging and spectroscopy<br />
Intensity (a.u., × 10 4 )<br />
Spectral amplitude (a.u.)<br />
2.5<br />
2.0<br />
1.5<br />
1.0<br />
0.5<br />
0.0<br />
-0.5<br />
-1.0<br />
10 6<br />
10 5<br />
10 4<br />
10 3<br />
10 2<br />
10 1<br />
0.0<br />
-0.2<br />
-0.4<br />
15 25<br />
5 10 15 20 25 30<br />
Optical delay (ps)<br />
0 1 2 3 4 5<br />
Frequency (THz)<br />
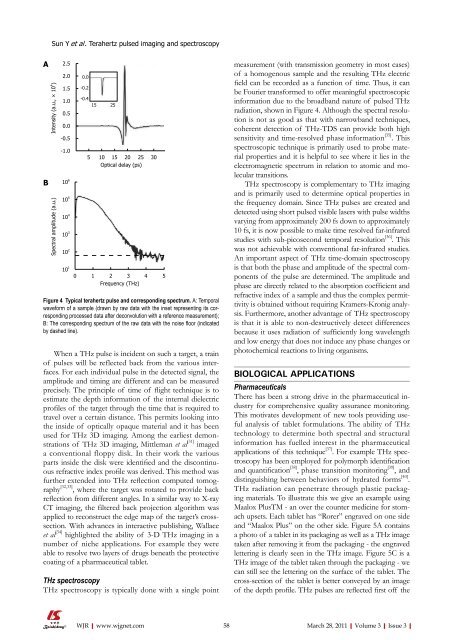
Figure 4 Typical terahertz pulse and corresponding spectrum. A: Temporal<br />
waveform <strong>of</strong> a sample (drawn by raw data with the inset representing its corresponding<br />
processed data after deconvolution with a reference measurement);<br />
B: The corresponding spectrum <strong>of</strong> the raw data with the noise floor (indicated<br />
by dashed line).<br />
When a THz pulse is incident on such a target, a train<br />
<strong>of</strong> pulses will be reflected back from the various interfaces.<br />
For each individual pulse in the detected signal, the<br />
amplitude and timing are different and can be measured<br />
precisely. The principle <strong>of</strong> time <strong>of</strong> flight technique is to<br />
estimate the depth information <strong>of</strong> the internal dielectric<br />
pr<strong>of</strong>iles <strong>of</strong> the target through the time that is required to<br />
travel over a certain distance. This permits looking into<br />
the inside <strong>of</strong> optically opaque material and it has been<br />
used for THz 3D imaging. Among the earliest demonstrations<br />
<strong>of</strong> THz 3D imaging, Mittleman et al [31] imaged<br />
a conventional floppy disk. In their work the various<br />
parts inside the disk were identified and the discontinuous<br />
refractive index pr<strong>of</strong>ile was derived. This method was<br />
further extended into THz reflection computed tomography<br />
[32,33] , where the target was rotated to provide back<br />
reflection from different angles. In a similar way to X-ray<br />
CT imaging, the filtered back projection algorithm was<br />
applied to reconstruct the edge map <strong>of</strong> the target’s crosssection.<br />
With advances in interactive publishing, Wallace<br />
et al [34] highlighted the ability <strong>of</strong> 3-D THz imaging in a<br />
number <strong>of</strong> niche applications. For example they were<br />
able to resolve two layers <strong>of</strong> drugs beneath the protective<br />
coating <strong>of</strong> a pharmaceutical tablet.<br />
THz spectroscopy<br />
THz spectroscopy is typically done with a single point<br />
WJR|www.wjgnet.com<br />
measurement (with transmission geometry in most cases)<br />
<strong>of</strong> a homogenous sample and the resulting THz electric<br />
field can be recorded as a function <strong>of</strong> time. Thus, it can<br />
be Fourier transformed to <strong>of</strong>fer meaningful spectroscopic<br />
information due to the broadband nature <strong>of</strong> pulsed THz<br />
radiation, shown in Figure 4. Although the spectral resolution<br />
is not as good as that with narrowband techniques,<br />
coherent detection <strong>of</strong> THz-TDS can provide both high<br />
sensitivity and time-resolved phase information [35] . This<br />
spectroscopic technique is primarily used to probe material<br />
properties and it is helpful to see where it lies in the<br />
electromagnetic spectrum in relation to atomic and molecular<br />
transitions.<br />
THz spectroscopy is complementary to THz imaging<br />
and is primarily used to determine optical properties in<br />
the frequency domain. Since THz pulses are created and<br />
detected using short pulsed visible lasers with pulse widths<br />
varying from approximately 200 fs down to approximately<br />
10 fs, it is now possible to make time resolved far-infrared<br />
studies with sub-picosecond temporal resolution [36] . This<br />
was not achievable with conventional far-infrared studies.<br />
An important aspect <strong>of</strong> THz time-domain spectroscopy<br />
is that both the phase and amplitude <strong>of</strong> the spectral components<br />
<strong>of</strong> the pulse are determined. The amplitude and<br />
phase are directly related to the absorption coefficient and<br />
refractive index <strong>of</strong> a sample and thus the complex permittivity<br />
is obtained without requiring Kramers-Kronig analysis.<br />
Furthermore, another advantage <strong>of</strong> THz spectroscopy<br />
is that it is able to non-destructively detect differences<br />
because it uses radiation <strong>of</strong> sufficiently long wavelength<br />
and low energy that does not induce any phase changes or<br />
photochemical reactions to living organisms.<br />
BIOLOGICAL APPLICATIONS<br />
Pharmaceuticals<br />
There has been a strong drive in the pharmaceutical industry<br />
for comprehensive quality assurance monitoring.<br />
This motivates development <strong>of</strong> new tools providing useful<br />
analysis <strong>of</strong> tablet formulations. The ability <strong>of</strong> THz<br />
technology to determine both spectral and structural<br />
information has fuelled interest in the pharmaceutical<br />
applications <strong>of</strong> this technique [37] . For example THz spectroscopy<br />
has been employed for polymorph identification<br />
and quantification [38] , phase transition monitoring [39] , and<br />
distinguishing between behaviors <strong>of</strong> hydrated forms [40] .<br />
THz radiation can penetrate through plastic packaging<br />
materials. To illustrate this we give an example using<br />
Maalox PlusTM - an over the counter medicine for stomach<br />
upsets. Each tablet has “Rorer” engraved on one side<br />
and “Maalox Plus” on the other side. Figure 5A contains<br />
a photo <strong>of</strong> a tablet in its packaging as well as a THz image<br />
taken after removing it from the packaging - the engraved<br />
lettering is clearly seen in the THz image. Figure 5C is a<br />
THz image <strong>of</strong> the tablet taken through the packaging - we<br />
can still see the lettering on the surface <strong>of</strong> the tablet. The<br />
cross-section <strong>of</strong> the tablet is better conveyed by an image<br />
<strong>of</strong> the depth pr<strong>of</strong>ile. THz pulses are reflected first <strong>of</strong>f the<br />
58 March 28, 2011|Volume 3|Issue 3|


