

3 - World Journal of Gastroenterology
3 - World Journal of Gastroenterology
3 - World Journal of Gastroenterology

Create successful ePaper yourself
Turn your PDF publications into a flip-book with our unique Google optimized e-Paper software.
Variability (%)<br />
Variability (%)<br />
30<br />
20<br />
10<br />
0<br />
30<br />
20<br />
10<br />
0<br />
Table 2 Three intertwined pipe phantom: intra-operator variability<br />
<strong>of</strong> semi-quantitative perfusion parameters following<br />
five 0.03/0.06 mL bolus injections <strong>of</strong> SonoVue ®<br />
0.03 mL/<br />
CV (%)<br />
0.06 mL/<br />
CV (%)<br />
PI<br />
FWMH<br />
PI TPI Slope <strong>of</strong><br />
the WI<br />
mice following three 0.02 mL, 0.05 mL or 0.1 mL bolus<br />
injections <strong>of</strong> SonoVue ® . Experiments were performed<br />
over 5 d.<br />
Chemical anesthesia: Four mice underwent chemical<br />
anesthesia. The body weight was found to be 23.5 g (min:<br />
22.6 g; max: 25 g) throughout the experiments. As experiments<br />
lasted over 5 d and due to the rapid doubling time<br />
<strong>of</strong> melanoma cells [32-34] , tumor volume ranged from 93.8<br />
to 599.7 mm 3 with a mean tumor value <strong>of</strong> 339.39 mm 3 . We<br />
calculated the semi-quantitative perfusion parameters directly<br />
from the TICs using the IGR mathematical model.<br />
CV values ranged from 1.48% to 29.97%. Table 4 shows<br />
variability values associated with each perfusion parameter<br />
for each mouse.<br />
Gaseous anesthesia: One mouse underwent gaseous<br />
anesthesia. It weighed 24.6 g. The tumor volume was<br />
503.56 mm 3 . CV values were determined based on the<br />
fitted TICs and ranged from 1.90% to 24.96%. More detailed<br />
results are provided in Table 4.<br />
WJR|www.wjgnet.com<br />
FWHM AUC AUWI AUWO<br />
3.16 7.69 9.65 5.56 2.33 8.55 5.32<br />
7.85 8.60 11.62 7.53 6.73 9.52 6.12<br />
CV: Coefficient <strong>of</strong> variation; PI: Peak intensity; TPI: Time to peak intensity;<br />
FWHM: Full width at half maximum; AUC: Area under the curve; AUWI:<br />
Area under the wash-in; AUWO: Area under the wash-out.<br />
Variability (%)<br />
Variability (%)<br />
30<br />
20<br />
10<br />
0<br />
30<br />
20<br />
10<br />
0<br />
TPI<br />
AUC<br />
Gauthier M et al . Variability <strong>of</strong> perfusion parameters using DCE-US<br />
Variability (%)<br />
30<br />
20<br />
10<br />
0<br />
Table 3 Dialyzer: intra-operator variability <strong>of</strong> semi-quantitative<br />
perfusion parameters following five 0.10 mL bolus injections<br />
<strong>of</strong> SonoVue ®<br />
0.10 mL/<br />
CV (%)<br />
Slope to PI<br />
PI TPI Slope <strong>of</strong><br />
the WI<br />
Single pipe: 0.02 mL SonoVue ®<br />
Single pipe: 0.05 mL SonoVue ®<br />
Single pipe: 0.08 mL SonoVue ®<br />
Three pipes: 0.03 mL SonoVue ®<br />
Three pipes: 0.06 mL SonoVue ®<br />
Dialyser: 0.10 mL SonoVue ®<br />
Mouse 1: 0.10 mL SonoVue ®<br />
Mouse 2: 0.05 mL SonoVue ®<br />
Mouse 3: 0.02 mL SonoVue ®<br />
Mouse 4: 0.10 mL SonoVue ®<br />
Mouse 5: 0.10 mL SonoVue ®<br />
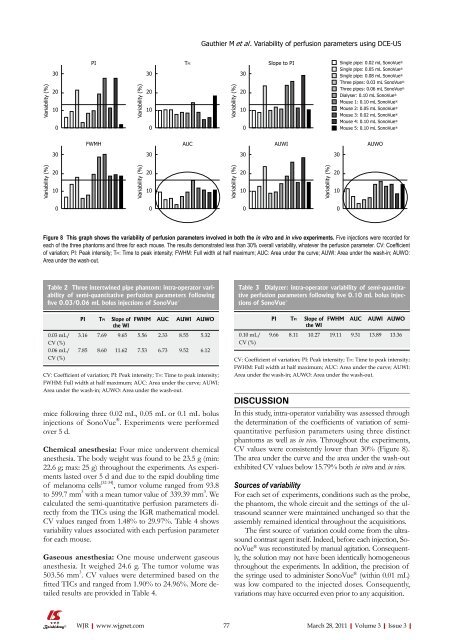
Figure 8 This graph shows the variability <strong>of</strong> perfusion parameters involved in both the in vitro and in vivo experiments. Five injections were recorded for<br />
each <strong>of</strong> the three phantoms and three for each mouse. The results demonstrated less than 30% overall variability, whatever the perfusion parameter. CV: Coefficient<br />
<strong>of</strong> variation; PI: Peak intensity; TPI: Time to peak intensity; FWHM: Full width at half maximum; AUC: Area under the curve; AUWI: Area under the wash-in; AUWO:<br />
Area under the wash-out.<br />
Variability (%)<br />
30<br />
20<br />
10<br />
0<br />
AUWI<br />
FWHM AUC AUWI AUWO<br />
9.66 8.11 10.27 19.11 9.31 13.89 13.36<br />
CV: Coefficient <strong>of</strong> variation; PI: Peak intensity; TPI: Time to peak intensity;<br />
FWHM: Full width at half maximum; AUC: Area under the curve; AUWI:<br />
Area under the wash-in; AUWO: Area under the wash-out.<br />
DISCUSSION<br />
In this study, intra-operator variability was assessed through<br />
the determination <strong>of</strong> the coefficients <strong>of</strong> variation <strong>of</strong> semiquantitative<br />
perfusion parameters using three distinct<br />
phantoms as well as in vivo. Throughout the experiments,<br />
CV values were consistently lower than 30% (Figure 8).<br />
The area under the curve and the area under the wash-out<br />
exhibited CV values below 15.79% both in vitro and in vivo.<br />
Sources <strong>of</strong> variability<br />
For each set <strong>of</strong> experiments, conditions such as the probe,<br />
the phantom, the whole circuit and the settings <strong>of</strong> the ultrasound<br />
scanner were maintained unchanged so that the<br />
assembly remained identical throughout the acquisitions.<br />
The first source <strong>of</strong> variation could come from the ultrasound<br />
contrast agent itself. Indeed, before each injection, SonoVue<br />
® was reconstituted by manual agitation. Consequently,<br />
the solution may not have been identically homogeneous<br />
throughout the experiments. In addition, the precision <strong>of</strong><br />
the syringe used to administer SonoVue ® (within 0.01 mL)<br />
was low compared to the injected doses. Consequently,<br />
variations may have occurred even prior to any acquisition.<br />
77 March 28, 2011|Volume 3|Issue 3|<br />
Variability (%)<br />
30<br />
20<br />
10<br />
0<br />
AUWO


