D28: Internal seiche mixing study - Hydromod
D28: Internal seiche mixing study - Hydromod
D28: Internal seiche mixing study - Hydromod

You also want an ePaper? Increase the reach of your titles
YUMPU automatically turns print PDFs into web optimized ePapers that Google loves.
Integrated Water Resource Management for Important Deep European Lakes and their Catchment Areas<br />
EUROLAKES<br />
<strong>D28</strong>: <strong>Internal</strong> <strong>seiche</strong> <strong>mixing</strong> <strong>study</strong><br />
FP5_Contract No.: EVK1-CT1999-00004<br />
Version: 1.2<br />
Date: 24.08.2004<br />
File: <strong>D28</strong>.doc<br />
Page 23 of 92<br />
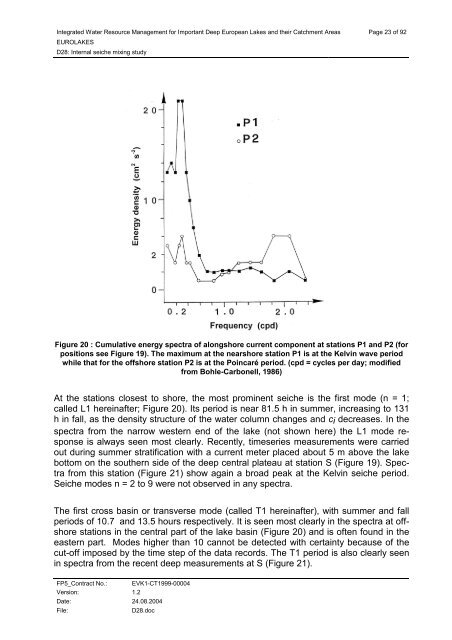
Figure 20 : Cumulative energy spectra of alongshore current component at stations P1 and P2 (for<br />
positions see Figure 19). The maximum at the nearshore station P1 is at the Kelvin wave period<br />
while that for the offshore station P2 is at the Poincaré period. (cpd = cycles per day; modified<br />
from Bohle-Carbonell, 1986)<br />
At the stations closest to shore, the most prominent <strong>seiche</strong> is the first mode (n = 1;<br />
called L1 hereinafter; Figure 20). Its period is near 81.5 h in summer, increasing to 131<br />
h in fall, as the density structure of the water column changes and ci decreases. In the<br />
spectra from the narrow western end of the lake (not shown here) the L1 mode response<br />
is always seen most clearly. Recently, timeseries measurements were carried<br />
out during summer stratification with a current meter placed about 5 m above the lake<br />
bottom on the southern side of the deep central plateau at station S (Figure 19). Spectra<br />
from this station (Figure 21) show again a broad peak at the Kelvin <strong>seiche</strong> period.<br />
Seiche modes n = 2 to 9 were not observed in any spectra.<br />
The first cross basin or transverse mode (called T1 hereinafter), with summer and fall<br />
periods of 10.7 and 13.5 hours respectively. It is seen most clearly in the spectra at offshore<br />
stations in the central part of the lake basin (Figure 20) and is often found in the<br />
eastern part. Modes higher than 10 cannot be detected with certainty because of the<br />
cut-off imposed by the time step of the data records. The T1 period is also clearly seen<br />
in spectra from the recent deep measurements at S (Figure 21).