D28: Internal seiche mixing study - Hydromod
D28: Internal seiche mixing study - Hydromod
D28: Internal seiche mixing study - Hydromod

Create successful ePaper yourself
Turn your PDF publications into a flip-book with our unique Google optimized e-Paper software.
Integrated Water Resource Management for Important Deep European Lakes and their Catchment Areas<br />
EUROLAKES<br />
Depth [m]<br />
<strong>D28</strong>: <strong>Internal</strong> <strong>seiche</strong> <strong>mixing</strong> <strong>study</strong><br />
-5<br />
-10<br />
-15<br />
-20<br />
-25<br />
-30<br />
-35<br />
-40<br />
4 6 8 10 12 14 16 18 20 22 24 26 28 30 32 34 36 38 40<br />
Days since 2002/05/01<br />
FP5_Contract No.: EVK1-CT1999-00004<br />
Version: 1.2<br />
Date: 24.08.2004<br />
File: <strong>D28</strong>.doc<br />
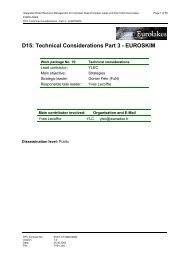
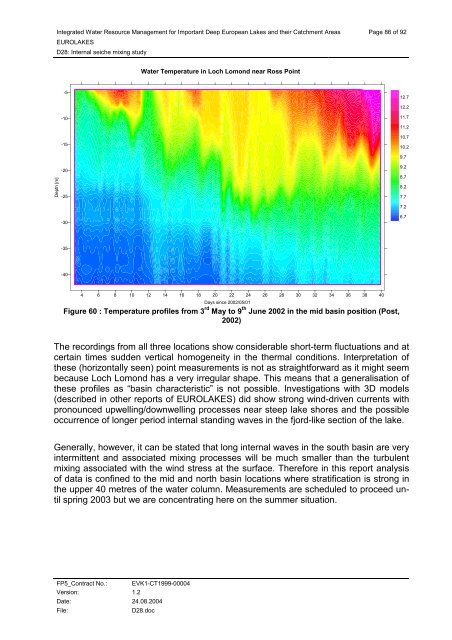
Water Temperature in Loch Lomond near Ross Point<br />
Page 86 of 92<br />
Figure 60 : Temperature profiles from 3 rd May to 9 th June 2002 in the mid basin position (Post,<br />
2002)<br />
The recordings from all three locations show considerable short-term fluctuations and at<br />
certain times sudden vertical homogeneity in the thermal conditions. Interpretation of<br />
these (horizontally seen) point measurements is not as straightforward as it might seem<br />
because Loch Lomond has a very irregular shape. This means that a generalisation of<br />
these profiles as “basin characteristic” is not possible. Investigations with 3D models<br />
(described in other reports of EUROLAKES) did show strong wind-driven currents with<br />
pronounced upwelling/downwelling processes near steep lake shores and the possible<br />
occurrence of longer period internal standing waves in the fjord-like section of the lake.<br />
Generally, however, it can be stated that long internal waves in the south basin are very<br />
intermittent and associated <strong>mixing</strong> processes will be much smaller than the turbulent<br />
<strong>mixing</strong> associated with the wind stress at the surface. Therefore in this report analysis<br />
of data is confined to the mid and north basin locations where stratification is strong in<br />
the upper 40 metres of the water column. Measurements are scheduled to proceed until<br />
spring 2003 but we are concentrating here on the summer situation.<br />
12.7<br />
12.2<br />
11.7<br />
11.2<br />
10.7<br />
10.2<br />
9.7<br />
9.2<br />
8.7<br />
8.2<br />
7.7<br />
7.2<br />
6.7