D28: Internal seiche mixing study - Hydromod
D28: Internal seiche mixing study - Hydromod
D28: Internal seiche mixing study - Hydromod

You also want an ePaper? Increase the reach of your titles
YUMPU automatically turns print PDFs into web optimized ePapers that Google loves.
Integrated Water Resource Management for Important Deep European Lakes and their Catchment Areas<br />
EUROLAKES<br />
<strong>D28</strong>: <strong>Internal</strong> <strong>seiche</strong> <strong>mixing</strong> <strong>study</strong><br />
FP5_Contract No.: EVK1-CT1999-00004<br />
Version: 1.2<br />
Date: 24.08.2004<br />
File: <strong>D28</strong>.doc<br />
Page 39 of 92<br />
turbulent transition and strongly intermittent turbulence at very low Reynolds numbers.<br />
Both effects, however, have to be expected at the location investigated. At present,<br />
there exists no satisfactory theory for this regime of turbulent flows, and only when the<br />
boundary layer is fully turbulent, Reynolds stress models as that use here can yield<br />
reasonable results even when turbulence is rather weak. This has been shown recently<br />
by Lorke et al. (2002) for the bottom boundary layer of a small lake.<br />
3.3.2.2 Mixing at the Entrance of the Petit Lac<br />
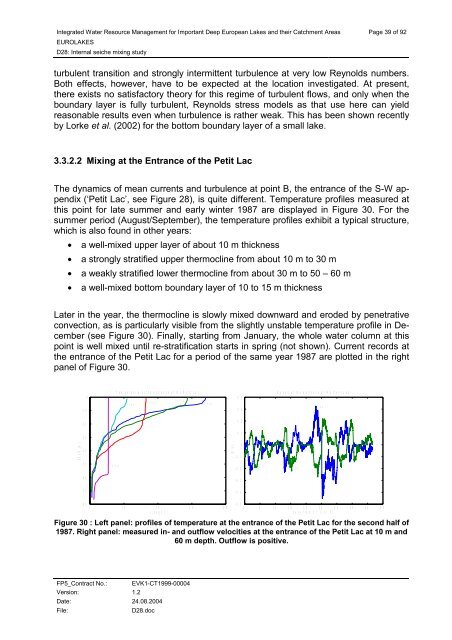
The dynamics of mean currents and turbulence at point B, the entrance of the S-W appendix<br />
(‘Petit Lac’, see Figure 28), is quite different. Temperature profiles measured at<br />
this point for late summer and early winter 1987 are displayed in Figure 30. For the<br />
summer period (August/September), the temperature profiles exhibit a typical structure,<br />
which is also found in other years:<br />
• a well-mixed upper layer of about 10 m thickness<br />
• a strongly stratified upper thermocline from about 10 m to 30 m<br />
• a weakly stratified lower thermocline from about 30 m to 50 – 60 m<br />
• a well-mixed bottom boundary layer of 10 to 15 m thickness<br />
Later in the year, the thermocline is slowly mixed downward and eroded by penetrative<br />
convection, as is particularly visible from the slightly unstable temperature profile in December<br />
(see Figure 30). Finally, starting from January, the whole water column at this<br />
point is well mixed until re-stratification starts in spring (not shown). Current records at<br />
the entrance of the Petit Lac for a period of the same year 1987 are plotted in the right<br />
panel of Figure 30.<br />
d e p t h ( m )<br />
- 1 0<br />
- 2 0<br />
- 3 0<br />
- 4 0<br />
- 5 0<br />
- 6 0<br />
- 7 0<br />
0<br />
1 6 D e c<br />
T e m p e r a t u r e a t t h e e n t r a n c e o f t h e P e t i t L a c<br />
1 7 N o v<br />
2 8 O k t<br />
1 0 S e p<br />
1 8 A u g<br />
- 8 0<br />
5 1 0 1 5 2 0 2 5<br />
t ( d e g C )<br />
v ( m / s )<br />
0 . 4<br />
0 . 3<br />
0 . 2<br />
0 . 1<br />
- 0 . 1<br />
- 0 . 2<br />
- 0 . 3<br />
- 0 . 4<br />
0<br />
S p e e d a t t h e e n t r a n c e o f t h e P e t i t L a c<br />
6 0 m<br />
- 0 . 5<br />
0 5 1 0 1 5 2 0 2 5 3 0 3 5 4 0 4 5<br />
d a y s f r o m 2 1 . O k t . 8 7<br />
Figure 30 : Left panel: profiles of temperature at the entrance of the Petit Lac for the second half of<br />
1987. Right panel: measured in- and outflow velocities at the entrance of the Petit Lac at 10 m and<br />
60 m depth. Outflow is positive.<br />
1 0 m