Constraints on Women Entrepreneurship Development in Kerala: An ...
Constraints on Women Entrepreneurship Development in Kerala: An ...
Constraints on Women Entrepreneurship Development in Kerala: An ...

You also want an ePaper? Increase the reach of your titles
YUMPU automatically turns print PDFs into web optimized ePapers that Google loves.
3. Enterprises and Entrepreneurs<br />
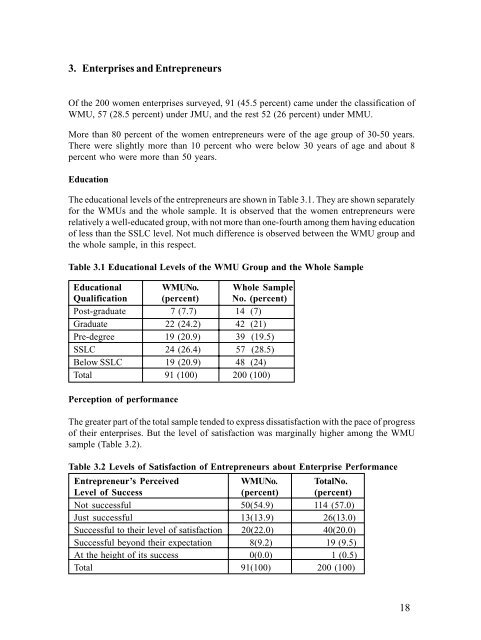
Of the 200 women enterprises surveyed, 91 (45.5 percent) came under the classificati<strong>on</strong> of<br />
WMU, 57 (28.5 percent) under JMU, and the rest 52 (26 percent) under MMU.<br />
More than 80 percent of the women entrepreneurs were of the age group of 30-50 years.<br />
There were slightly more than 10 percent who were below 30 years of age and about 8<br />
percent who were more than 50 years.<br />
Educati<strong>on</strong><br />
The educati<strong>on</strong>al levels of the entrepreneurs are shown <strong>in</strong> Table 3.1. They are shown separately<br />
for the WMUs and the whole sample. It is observed that the women entrepreneurs were<br />
relatively a well-educated group, with not more than <strong>on</strong>e-fourth am<strong>on</strong>g them hav<strong>in</strong>g educati<strong>on</strong><br />
of less than the SSLC level. Not much difference is observed between the WMU group and<br />
the whole sample, <strong>in</strong> this respect.<br />
Table 3.1 Educati<strong>on</strong>al Levels of the WMU Group and the Whole Sample<br />
Educati<strong>on</strong>al WMUNo. Whole Sample<br />
Qualificati<strong>on</strong> (percent) No. (percent)<br />
Post-graduate 7 (7.7) 14 (7)<br />
Graduate 22 (24.2) 42 (21)<br />
Pre-degree 19 (20.9) 39 (19.5)<br />
SSLC 24 (26.4) 57 (28.5)<br />
Below SSLC 19 (20.9) 48 (24)<br />
Total 91 (100) 200 (100)<br />
Percepti<strong>on</strong> of performance<br />
The greater part of the total sample tended to express dissatisfacti<strong>on</strong> with the pace of progress<br />
of their enterprises. But the level of satisfacti<strong>on</strong> was marg<strong>in</strong>ally higher am<strong>on</strong>g the WMU<br />
sample (Table 3.2).<br />
Table 3.2 Levels of Satisfacti<strong>on</strong> of Entrepreneurs about Enterprise Performance<br />
Entrepreneur’s Perceived WMUNo. TotalNo.<br />
Level of Success (percent) (percent)<br />
Not successful 50(54.9) 114 (57.0)<br />
Just successful 13(13.9) 26(13.0)<br />
Successful to their level of satisfacti<strong>on</strong> 20(22.0) 40(20.0)<br />
Successful bey<strong>on</strong>d their expectati<strong>on</strong> 8(9.2) 19 (9.5)<br />
At the height of its success 0(0.0) 1 (0.5)<br />
Total 91(100) 200 (100)<br />
18