Constraints on Women Entrepreneurship Development in Kerala: An ...
Constraints on Women Entrepreneurship Development in Kerala: An ...
Constraints on Women Entrepreneurship Development in Kerala: An ...

Create successful ePaper yourself
Turn your PDF publications into a flip-book with our unique Google optimized e-Paper software.
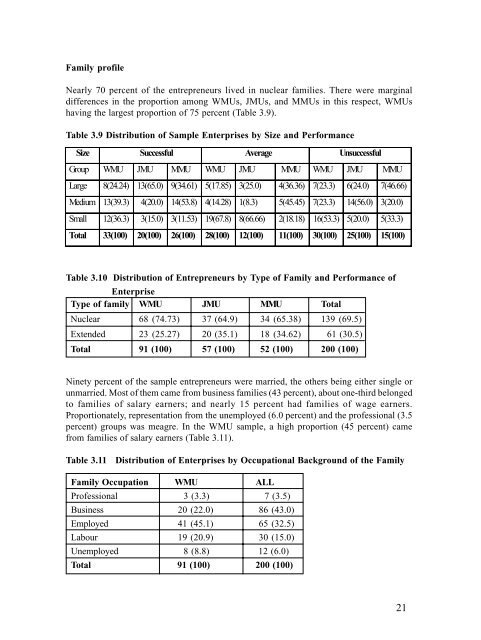
Family profile<br />
Nearly 70 percent of the entrepreneurs lived <strong>in</strong> nuclear families. There were marg<strong>in</strong>al<br />
differences <strong>in</strong> the proporti<strong>on</strong> am<strong>on</strong>g WMUs, JMUs, and MMUs <strong>in</strong> this respect, WMUs<br />
hav<strong>in</strong>g the largest proporti<strong>on</strong> of 75 percent (Table 3.9).<br />
Table 3.9 Distributi<strong>on</strong> of Sample Enterprises by Size and Performance<br />
Size Successful Average Unsuccessful<br />
Group WMU JMU MMU WMU JMU MMU WMU JMU MMU<br />
Large 8(24.24) 13(65.0) 9(34.61) 5(17.85) 3(25.0) 4(36.36) 7(23.3) 6(24.0) 7(46.66)<br />
Medium 13(39.3) 4(20.0) 14(53.8) 4(14.28) 1(8.3) 5(45.45) 7(23.3) 14(56.0) 3(20.0)<br />
Small 12(36.3) 3(15.0) 3(11.53) 19(67.8) 8(66.66) 2(18.18) 16(53.3) 5(20.0) 5(33.3)<br />
Total 33(100) 20(100) 26(100) 28(100) 12(100) 11(100) 30(100) 25(100) 15(100)<br />
Table 3.10 Distributi<strong>on</strong> of Entrepreneurs by Type of Family and Performance of<br />
Enterprise<br />
Type of family WMU JMU MMU Total<br />
Nuclear 68 (74.73) 37 (64.9) 34 (65.38) 139 (69.5)<br />
Extended 23 (25.27) 20 (35.1) 18 (34.62) 61 (30.5)<br />
Total 91 (100) 57 (100) 52 (100) 200 (100)<br />
N<strong>in</strong>ety percent of the sample entrepreneurs were married, the others be<strong>in</strong>g either s<strong>in</strong>gle or<br />
unmarried. Most of them came from bus<strong>in</strong>ess families (43 percent), about <strong>on</strong>e-third bel<strong>on</strong>ged<br />
to families of salary earners; and nearly 15 percent had families of wage earners.<br />
Proporti<strong>on</strong>ately, representati<strong>on</strong> from the unemployed (6.0 percent) and the professi<strong>on</strong>al (3.5<br />
percent) groups was meagre. In the WMU sample, a high proporti<strong>on</strong> (45 percent) came<br />
from families of salary earners (Table 3.11).<br />
Table 3.11 Distributi<strong>on</strong> of Enterprises by Occupati<strong>on</strong>al Background of the Family<br />
Family Occupati<strong>on</strong> WMU ALL<br />
Professi<strong>on</strong>al 3 (3.3) 7 (3.5)<br />
Bus<strong>in</strong>ess 20 (22.0) 86 (43.0)<br />
Employed 41 (45.1) 65 (32.5)<br />
Labour 19 (20.9) 30 (15.0)<br />
Unemployed 8 (8.8) 12 (6.0)<br />
Total 91 (100) 200 (100)<br />
21