Novo-Nordisk-AR-2012-en
Novo-Nordisk-AR-2012-en
Novo-Nordisk-AR-2012-en
- No tags were found...

You also want an ePaper? Increase the reach of your titles
YUMPU automatically turns print PDFs into web optimized ePapers that Google loves.
4 ACCOMPLISHMENTS ACCOMPLISHMENTS AND RESULTS <strong>2012</strong><br />
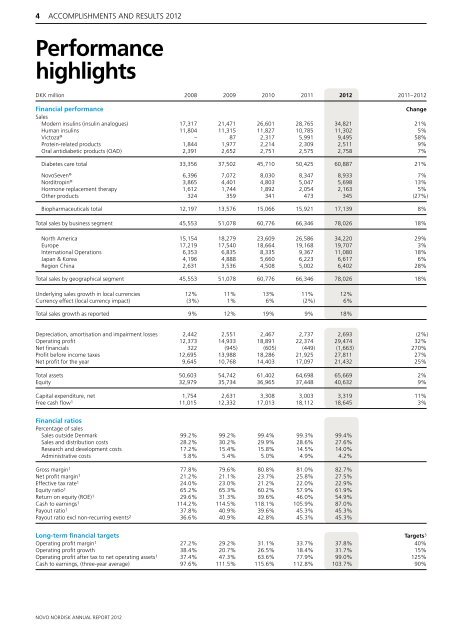
Performance highlights<br />
highlights<br />
DKK million 2008 2009 2010 2011 <strong>2012</strong> 2011–<strong>2012</strong><br />
Financial performance Change<br />
Sales<br />
Modern insulins (insulin analogues) 17,317 21,471 26,601 28,765 34,821 21%<br />
Human insulins 11,804 11,315 11,827 10,785 11,302 5%<br />
Victoza ® – 87 2,317 5,991 9,495 58%<br />
Protein-related products 1,844 1,977 2,214 2,309 2,511 9%<br />
Oral antidiabetic products (OAD) 2,391 2,652 2,751 2,575 2,758 7%<br />
Diabetes care total 33,356 37,502 45,710 50,425 60,887 21%<br />
<strong>Novo</strong>Sev<strong>en</strong> ® 6,396 7,072 8,030 8,347 8,933 7%<br />
Norditropin ® 3,865 4,401 4,803 5,047 5,698 13%<br />
Hormone replacem<strong>en</strong>t therapy 1,612 1,744 1,892 2,054 2,163 5%<br />
Other products 324 359 341 473 345 (27%)<br />
Biopharmaceuticals total 12,197 13,576 15,066 15,921 17,139 8%<br />
Total sales by business segm<strong>en</strong>t 45,553 51,078 60,776 66,346 78,026 18%<br />
North America 15,154 18,279 23,609 26,586 34,220 29%<br />
Europe 17,219 17,540 18,664 19,168 19,707 3%<br />
International Operations 6,353 6,835 8,335 9,367 11,080 18%<br />
Japan & Korea 4,196 4,888 5,660 6,223 6,617 6%<br />
Region China 2,631 3,536 4,508 5,002 6,402 28%<br />
Total sales by geographical segm<strong>en</strong>t 45,553 51,078 60,776 66,346 78,026 18%<br />
Underlying sales growth in local curr<strong>en</strong>cies 12% 11% 13% 11% 12%<br />
Curr<strong>en</strong>cy effect (local curr<strong>en</strong>cy impact) (3%) 1% 6% (2%) 6%<br />
Total sales growth as reported 9% 12% 19% 9% 18%<br />
Depreciation, amortisation and impairm<strong>en</strong>t losses 2,442 2,551 2,467 2,737 2,693 (2%)<br />
Operating profi t 12,373 14,933 18,891 22,374 29,474 32%<br />
Net fi nancials 322 (945) (605) (449) (1,663) 270%<br />
Profi t before income taxes 12,695 13,988 18,286 21,925 27,811 27%<br />
Net profi t for the year 9,645 10,768 14,403 17,097 21,432 25%<br />
Total assets 50,603 54,742 61,402 64,698 65,669 2%<br />
Equity 32,979 35,734 36,965 37,448 40,632 9%<br />
Capital exp<strong>en</strong>diture, net 1,754 2,631 3,308 3,003 3,319 11%<br />
Free cash fl ow 1 11,015 12,332 17,013 18,112 18,645 3%<br />
Financial ratios<br />
Perc<strong>en</strong>tage of sales<br />
Sales outside D<strong>en</strong>mark 99.2% 99.2% 99.4% 99.3% 99.4%<br />
Sales and distribution costs 28.2% 30.2% 29.9% 28.6% 27.6%<br />
Research and developm<strong>en</strong>t costs 17.2% 15.4% 15.8% 14.5% 14.0%<br />
Administrative costs 5.8% 5.4% 5.0% 4.9% 4.2%<br />
Gross margin 1 77.8% 79.6% 80.8% 81.0% 82.7%<br />
Net profi t margin 1 21.2% 21.1% 23.7% 25.8% 27.5%<br />
Effective tax rate 1 24.0% 23.0% 21.2% 22.0% 22.9%<br />
Equity ratio 1 65.2% 65.3% 60.2% 57.9% 61.9%<br />
Return on equity (ROE) 1 29.6% 31.3% 39.6% 46.0% 54.9%<br />
Cash to earnings 1 114.2% 114.5% 118.1% 105.9% 87.0%<br />
Payout ratio 1 37.8% 40.9% 39.6% 45.3% 45.3%<br />
Payout ratio excl non-recurring ev<strong>en</strong>ts 2 36.6% 40.9% 42.8% 45.3% 45.3%<br />
Long-term fi nancial targets Targets 3<br />
Operating profi t margin 1 27.2% 29.2% 31.1% 33.7% 37.8% 40%<br />
Operating profi t growth 38.4% 20.7% 26.5% 18.4% 31.7% 15%<br />
Operating profi t after tax to net operating assets 1 37.4% 47.3% 63.6% 77.9% 99.0% 125%<br />
Cash to earnings, (three-year average) 97.6% 111.5% 115.6% 112.8% 103.7% 90%<br />
NOVO NORDISK ANNUAL REPORT <strong>2012</strong>