

Greece in Figures 2008 - Icap
Greece in Figures 2008 - Icap
Greece in Figures 2008 - Icap

You also want an ePaper? Increase the reach of your titles
YUMPU automatically turns print PDFs into web optimized ePapers that Google loves.
<strong>Greece</strong> <strong>in</strong> <strong>Figures</strong> 2010 www.icap.gr<br />
226<br />
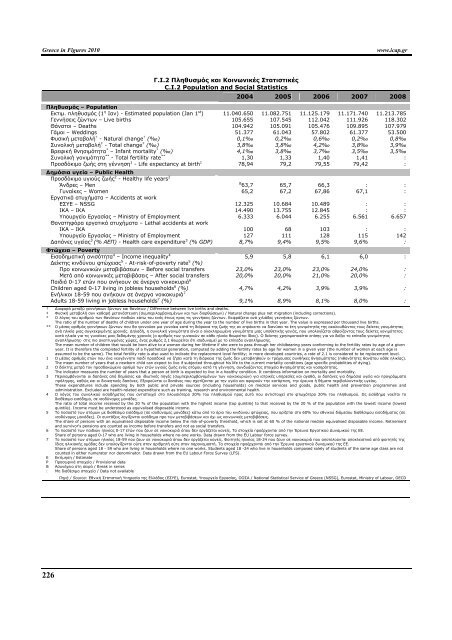
Γ.Ι.2 Πληθυσµός και Κοινωνικές Στατιστικές<br />
C.I.2 Population and Social Statistics<br />
2004 2005 2006 2007 <strong>2008</strong><br />
Πληθυσµός – Population<br />
Εκτιµ. πληθυσµός (1 η Ιαν) - Estimated population (Jan 1 st ) 11.040.650 11.082.751 11.125.179 11.171.740 11.213.785<br />
Γεννήσεις ζώντων – Live births 105.655 107.545 112.042 111.926 118.302<br />
Θάνατοι – Deaths 104.942 105.091 105.476 109.895 107.979<br />
Γάµοι – Wedd<strong>in</strong>gs 51.377 61.043 57.802 61.377 53.500<br />
Φυσική µεταβολή † - Natural change † (‰) 0,1‰ 0,2‰ 0,6‰ 0,2‰ 0,8‰<br />
Συνολική µεταβολή ‡ - Total change ‡ (‰) 3,8‰ 3,8‰ 4,2‰ 3,8‰ 3,9‰<br />
Βρεφική θνησιµότητα * – Infant mortality * (‰) 4,1‰ 3,8‰ 3,7‰ 3,5‰ 3,5‰<br />
Συνολική γονιµότητα ** - Total fertility rate ** 1,30 1,33 1,40 1,41 :<br />
Προσδόκιµο ζωής στη γέννηση 1 - Life expectancy at birth 1 78,94 79,2 79,55 79,42 :<br />
∆ηµόσια υγεία – Public Health<br />
Προσδόκιµο υγιούς ζωής 2 - Healthy life years 2<br />
Άνδρες – Men<br />
B<br />
63,7 65,7 66,3 : :<br />
Γυναίκες – Women<br />
Εργατικά ατυχήµατα – Accidents at work<br />
65,2 67,2 67,86 67,1 :<br />
ΕΣΥΕ – NSSG 12.325 10.684 10.489 : :<br />
IKA – ΙΚΑ 14.490 13.755 12.845 : :<br />
Υπουργείο Εργασίας – M<strong>in</strong>istry of Employment<br />
Θανατηφόρα εργατικά ατυχήµατα – Lethal accidents at work<br />
6.333 6.044 6.255 6.561 6.657<br />
IKA – ΙΚΑ 100 68 103 : :<br />
Υπουργείο Εργασίας – M<strong>in</strong>istry of Employment 127 111 128 115 142<br />
∆απάνες υγείας 3 (% ΑΕΠ) - Health care expenditure 3 (% GDP) 8,7% 9,4% 9,5% 9,6% :<br />
Φτώχεια – Poverty<br />
Εισοδηµατική ανισότητα 4 – Income <strong>in</strong>equality 4 5,9 5,8 6,1 6,0 :<br />
∆είκτης κινδύνου φτώχειας 5 - At-risk-of-poverty rate 5 (%)<br />
Προ κοινωνικών µεταβιβάσεων – Βefore social transfers 23,0% 23,0% 23,0% 24,0% :<br />
Μετά από κοινωνικές µεταβιβάσεις – After social transfers 20,0% 20,0% 21,0% 20,0% :<br />
Παιδιά 0-17 ετών που ανήκουν σε άνεργα νοικοκυριά 6<br />
Children aged 0-17 liv<strong>in</strong>g <strong>in</strong> jobless households 6 (%) 4,7% 4,2% 3,9% 3,9% :<br />
Ενήλικοι 18-59 που ανήκουν σε άνεργα νοικοκυριά 7<br />
Adults 18-59 liv<strong>in</strong>g <strong>in</strong> jobless households 7 (%) 9,1% 8,9% 8,1% 8,0% :<br />
† ∆ιαφορά µεταξύ γεννήσεων ζώντων και θανάτων / Difference between live births and deaths.<br />
‡ Φυσική µεταβολή συν καθαρή µετανάστευση (συµπεριλαµβανοµένων και των διορθώσεων) / Natural change plus net migration (<strong>in</strong>clud<strong>in</strong>g corrections).<br />
* Ο λόγος του αριθµού των θανάτων παιδιών κάτω του ενός έτους προς τις γεννήσεις ζώντων. Εκφράζεται ανά χιλιάδες γεννήσεις ζώντων.<br />
The ratio of the number of deaths of children under one year of age dur<strong>in</strong>g the year to the number of live births <strong>in</strong> that year. The value is expressed per thousand live births.<br />
** Ο µέσος αριθµός γεννήσεων ζώντων που θα γεννούσε µια γυναίκα κατά τη διάρκεια της ζωής της αν επρόκειτο να διανύσει τα έτη γονιµότητάς της ακολουθώντας τους δείκτες γονιµότητας<br />
ανά ηλικία µιας συγκεκριµένης χρονιάς. ∆ηλαδή, η συνολική γονιµότητα είναι ο ολοκληρωµένη γονιµότητα µιας υποθετικής γενιάς, που υπολογίζεται αθροίζοντας τους δείκτες γονιµότητας<br />
κατά ηλικία για τις γυναίκες µιας δεδοµένης χρονιάς (ο αριθµός των γυναικών σε κάθε ηλικία θεωρείται ίδιος). Ο δείκτης χρησιµοποιείται επίσης για να δείξει το επίπεδο γονιµότητας<br />
αναπλήρωσης· στις πιο ανεπτυγµένες χώρες, ένας ρυθµός 2,1 θεωρείται ότι ισοδυναµεί µε το επίπεδο αναπλήρωσης.<br />
The mean number of children that would be born alive to a woman dur<strong>in</strong>g her lifetime if she were to pass through her childbear<strong>in</strong>g years conform<strong>in</strong>g to the fertility rates by age of a given<br />
year. It is therefore the completed fertility of a hypothetical generation, computed by add<strong>in</strong>g the fertility rates by age for women <strong>in</strong> a given year (the number of women at each age is<br />
assumed to be the same). The total fertility rate is also used to <strong>in</strong>dicate the replacement level fertility; <strong>in</strong> more developed countries, a rate of 2.1 is considered to be replacement level.<br />
1 Ο µέσος αριθµός ετών που ένα νεογέννητο παιδί προσδοκά να ζήσει κατά τη διάρκεια της ζωής δεν µεταβληθούν οι τρέχουσες συνθήκες θνησιµότητας (πιθανότητες θανάτου κάθε ηλικίας).<br />
Τhe mean number of years that a newborn child can expect to live if subjected throughout his life to the current mortality conditions (age specific probabilities of dy<strong>in</strong>g).<br />
2 Ο δείκτης µετρά τον προσδοκώµενο αριθµό των ετών υγιούς ζωής ενός ατόµου κατά τη γέννηση, συνδυάζοντας στοιχεία θνησιµότητας και νοσηρότητας.<br />
The <strong>in</strong>dicator measures the number of years that a person at birth is expected to live <strong>in</strong> a healthy condition. It comb<strong>in</strong>es <strong>in</strong>formation on mortality and morbidity.<br />
3 Περιλαµβάνονται οι δαπάνες από δηµόσιες και ιδιωτικές πηγές (συµπεριλαµβανοµένων των νοικοκυριών) για ιατρικές υπηρεσίες και αγαθά, οι δαπάνες για δηµόσια υγεία και προγράµµατα<br />
πρόληψης, καθώς και οι διοικητικές δαπάνες. Εξαιρούνται οι δαπάνες που σχετίζονται µε την υγεία και αφορούν την κατάρτιση, την έρευνα ή θέµατα περιβαλλοντικής υγείας.<br />
These expenditures <strong>in</strong>clude spend<strong>in</strong>g by both public and private sources (<strong>in</strong>clud<strong>in</strong>g households) on medical services and goods, public health and prevention programmes and<br />
adm<strong>in</strong>istration. Excluded are health-related expenditure such as tra<strong>in</strong><strong>in</strong>g, research and environmental health.<br />
4 Ο λόγος του συνολικού εισοδήµατος που αντιστοιχεί στο πλουσιότερο 20% του πληθυσµού προς αυτό που αντιστοιχεί στο φτωχότερο 20% του πληθυσµού. Ως εισόδηµα νοείται το<br />
διαθέσιµο εισόδηµα, σε ισοδύναµες µονάδες.<br />
The ratio of total <strong>in</strong>come received by the 20 % of the population with the highest <strong>in</strong>come (top qu<strong>in</strong>tile) to that received by the 20 % of the population with the lowest <strong>in</strong>come (lowest<br />
qu<strong>in</strong>tile). Income must be understood as equivalised disposable <strong>in</strong>come.<br />
5 Το ποσοστό των ατόµων µε διαθέσιµο εισόδηµα (σε ισοδύναµες µονάδες) κάτω από το όριο του κινδύνου φτώχειας, που ορίζεται στο 60% του εθνικού διάµεσου διαθέσιµου εισοδήµατος (σε<br />
ισοδύναµες µονάδες). Οι συντάξεις λογίζονται εισόδηµα προ των µεταβιβάσεων και όχι ως κοινωνικές µεταβιβάσεις.<br />
The share of persons with an equivalised disposable <strong>in</strong>come below the risk-of-poverty threshold, which is set at 60 % of the national median equivalised disposable <strong>in</strong>come. Retirement<br />
and survivor's pensions are counted as <strong>in</strong>come before transfers and not as social transfers.<br />
6 Το ποσοστό των παιδιών ηλικίας 0-17 ετών που ζουν σε νοικοκυριά όπου δεν εργάζεται κανείς. Τα στοιχεία προέρχονται από την Έρευνα Εργατικού ∆υναµικού της ΕΕ.<br />
Share of persons aged 0-17 who are liv<strong>in</strong>g <strong>in</strong> households where no-one works. Data drawn from the EU Labour force survey.<br />
7 To ποσοστό των ατόµων ηλικίας 18-59 που ζουν σε νοικοκυριά όπου δεν εργάζεται κανείς. Φοιτητές ηλικίας 18-24 που ζουν σε νοικοκυριά που αποτελούνται αποκλειστικά από φοιτητές της<br />
ίδιας ηλικιακής οµάδας δεν υπολογίζονται ούτε στον αριθµητή ούτε στον παρονοµαστή. Τα στοιχεία προέρχονται από την Έρευνα εργατικού δυναµικού της ΕΕ.<br />
Share of persons aged 18 - 59 who are liv<strong>in</strong>g <strong>in</strong> households where no one works. Students aged 18 -24 who live <strong>in</strong> households composed solely of students of the same age class are not<br />
counted <strong>in</strong> either numerator nor denom<strong>in</strong>ator. Data drawn from the EU Labour Force Survey (LFS).<br />
E Εκτίµηση / Estimate<br />
P Προσωρινά στοιχεία / Provisional data<br />
B Ασυνέχεια στη σειρά / Break <strong>in</strong> series<br />
: Μη διαθέσιµα στοιχεία / Data not available<br />
Πηγή / Source: Εθνική Στατιστική Υπηρεσία της Ελλάδος (ΕΣΥΕ), Eurostat, Υπουργείο Εργασίας, ΟΟΣΑ / National Statistical Service of <strong>Greece</strong> (NSSG), Eurostat, M<strong>in</strong>istry of Labour, OECD