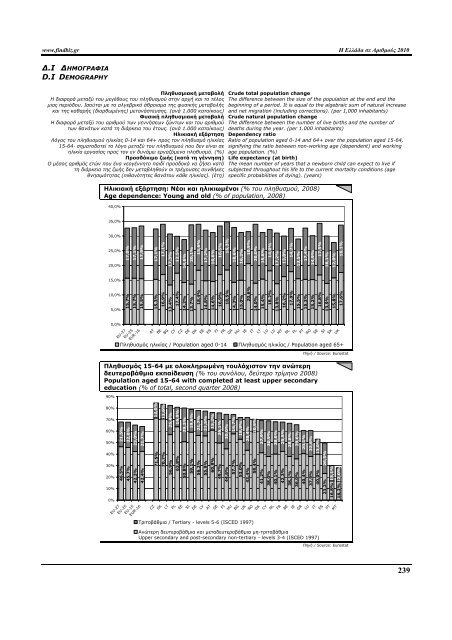
www.f<strong>in</strong>dbiz.gr Η Ελλάδα σε Αριθµούς 2010 ∆.Ι ∆ΗΜΟΓΡΑΦΙΑ D.I DEMOGRAPHY Πληθυσµιακή µεταβολή Η διαφορά µεταξύ του µεγέθους του πληθυσµού στην αρχή και το τέλος µιας περιόδου. Ισούται µε το αλγεβρικό άθροισµα της φυσικής µεταβολής και της καθαρής (διορθωµένης) µετανάστευσης. (ανά 1.000 κατοίκους) Φυσική πληθυσµιακή µεταβολή Η διαφορά µεταξύ του αριθµού των γεννήσεων ζώντων και του αριθµού των θανάτων κατά τη διάρκεια του έτους. (ανά 1.000 κατοίκους) Ηλικιακή εξάρτηση Λόγος του πληθυσµού ηλικίας 0-14 και 64+ προς τον πληθυσµό ηλικίας 15-64· σηµατοδοτεί το λόγο µεταξύ του πληθυσµού που δεν είναι σε ηλικία εργασίας προς τον εν δυνάµει εργαζόµενο πληθυσµό. (%) Προσδόκιµο ζωής (κατά τη γέννηση) Ο µέσος αριθµός ετών που ένα νεογέννητο παιδί προσδοκά να ζήσει κατά τη διάρκεια της ζωής δεν µεταβληθούν οι τρέχουσες συνθήκες θνησιµότητας (πιθανότητες θανάτου κάθε ηλικίας). (έτη) Crude total population change The difference between the size of the population at the end and the beg<strong>in</strong>n<strong>in</strong>g of a period. It is equal to the algebraic sum of natural <strong>in</strong>crease and net migration (<strong>in</strong>clud<strong>in</strong>g corrections). (per 1,000 <strong>in</strong>habitants) Crude natural population change The difference between the number of live births and the number of deaths dur<strong>in</strong>g the year. (per 1.000 <strong>in</strong>habitants) Dependency ratio Ratio of population aged 0-14 and 64+ over the population aged 15-64, signify<strong>in</strong>g the ratio between non-work<strong>in</strong>g age (dependent) and work<strong>in</strong>g age population. (%) Life expectancy (at birth) The mean number of years that a newborn child can expect to live if subjected throughout his life to the current mortality conditions (age specific probabilities of dy<strong>in</strong>g). (years) Ηλικιακή εξάρτηση: Νέοι και ηλικιωµένοι (% του πληθυσµού, <strong>2008</strong>) Age dependence: Young and old (% of population, <strong>2008</strong>) 40,0% 35,0% 30,0% 25,0% 20,0% 15,0% 10,0% 5,0% 0,0% 17,0% 17,1% 15,7% 15,7% 17,9% 15,5% EU-27 EU-25 EUR-16 17,1% 17,1% 15,3% 16,9% AT BE 17,3% 12,5% 13,4% 17,4% 14,6% 20,1% 15,6% 14,2% 13,7% 18,4% 17,2% 16,6% 16,5% 16,3% 18,6% 16,2% 10,9% 14,8% 14,6% 16,9% 18,5% BG CY CZ DE DK EE ES FI FR 14,3% 15,0% 20,6% 20,0% 14,0% 15,4% 15,8% 14,0% 18,2% 17,2% 13,8% 14,7% 13,8% 16,2% 17,9% GR HU IE IT LT LU LV MT NL 13,5% 17,4% 14,9% 17,5% 16,1% 12,0% 16,1% 15,5% 15,3% 15,2% 16,8% 13,9% 15,8% 17,6% PL PT RO SE SI SK UK Πληθυσµός ηλικίας / Population aged 0-14 Πληθυσµός ηλικίας / Population aged 65+ Πληθυσµός 15-64 µε ολοκληρωµένη τουλάχιστον την ανώτερη δευτεροβάθµια εκπαίδευση (% του συνόλου, δεύτερο τρίµηνο <strong>2008</strong>) Population aged 15-64 with completed at least upper secondary education (% of total, second quarter <strong>2008</strong>) 90% 80% 70% 60% 50% 40% 30% 20% 10% 0% 21,5% 22,0% 23,0% 21,7% 46,5% 45,7% 42,3% 42,4% EU-27 EU-25 EU-15 EUR-16 13,0% 12,6% 71,5% 70,7% 25,4% 16,9% 29,3% 19,6% 21,7% 21,5% 15,2% 56,9% 63,8% 50,8% 59,1% 56,2% 55,9% 60,9% CZ SK LT PL EE SI 26,1% 49,7% 30,0% 16,7% 44,6% 57,7% 18,9% 53,0% 28,4% 10,9% 43,4% 59,4% DE LV AT SE FI HU BG UK RO DK Τριτοβάθµια / Tertiary - levels 5-6 (ISCED 1997) 27,9% 30,9% 41,2% 38,0% 28,0% 25,5% 28,8% 40,1% 42,3% 29,6% 38,1% 36,0% CY NL FR BE IE Πηγή / Source: Eurostat 20,1% 22,6% 40,4% 37,9% Ανώτερη δευτεροβάθµια και µεταδευτεροβάθµια µη-τριτοβάθµια Upper secondary and post-secondary non-tertiary - levels 3-4 (ISCED 1997) 13,0% 40,0% 26,5% 23,2% 13,1% 12,0% 16,8% 16,2% GR LU IT ES PT MT Πηγή / Source: Eurostat 239
240 ∆είκτης Indicator Πληθυσµός Population Έκταση Area Πυκνότητα Density ∆.Ι.1 ∆ηµογραφία D.I.1 Demography Πληθ. µεταβολή Λόγος εξάρτησης Populat. change Dependency ratio Προσδόκιµο ζωής Life expectancy Άνδρες – Men Γυναίκες- Women Έτος - Year 1.1.2009 - 2009 <strong>2008</strong> <strong>2008</strong> 2007 2007 Μονάδες - Units χιλιάδες thousands τετραγωνικά χλµ. κάτοικοι ανά τ.χλµ. square km’s <strong>in</strong>habitants / km 2 ‰ % Έτη, στη γέννηση Years, at birth Έτη, στη γέννηση Years, at birth EU-27 499.747,2 4.241.101 117,8 4,2 48,7 EU-25 470.642,0 3.892.691 120,9 4,6 49,0 EUR-16 328.653,4 2.535.152 129,6 4,7 50,1 1 75,8 1 76,3 1 77,3 ∆ιαγράµµατα Charts 1 82,0 Φυσική µεταβολή πληθυσµού 1 82,4 Crude natural popul. change AT BE BG CY CZ 8.355,3 10.754,5 7.606,6 794,0 10.467,5 83.859 30.518 110.910 9.250 78.860 99,6 352,4 68,6 85,8 132,7 4,4 8,2 -4,4 5,9 8,3 48,1 51,4 44,3 42,7 40,4 77,5 77,1 69,5 77,8 73,8 83,1 82,6 76,7 82,2 80,2 0,9 0,7 0,5 0,3 0,1 DE 82.002,4 357.020 229,7 -2,6 51,1 77,4 82,7 -0,1 DK 5.511,5 43.094 127,9 7,2 51,6 76,2 80,6 -0,3 EE ES 1.340,4 45.828,2 45.228 504.790 29,6 90,8 -0,4 12,0 47,1 45,4 67,2 77,8 78,8 84,3 1998 1999 2000 2001 2002 2003 2004 2005 2006 2007 <strong>2008</strong> ‰ Ελλάδα - <strong>Greece</strong> ΕΕ-27 - EU 27 FI 5.326,3 304.529 17,5 4,9 50,1 76,0 83,1 Συνολική µεταβολή πληθυσµού FR 64.351,0 543.965 118,3 5,7 53,4 1 77,3 1 84,4 Crude total population change GR HU 11.257,3 10.031,2 131.626 93.029 85,5 107,8 3,9 -1,4 49,1 45,3 77,1 69,4 81,8 77,8 6,0 IE 4.465,5 70.273 63,5 14,5 45,9 77,4 82,1 5,0 IT 60.053,4 301.333 199,3 7,3 51,7 1 78,5 1 84,2 4,0 LT LU 3.349,9 493,5 65.300 2.586 51,3 190,8 -4,9 19,9 45,3 47,4 64,9 76,7 77,2 82,2 3,0 LV 2.261,3 64.589 35,0 -4,2 44,8 65,8 76,5 2,0 MT 413,6 316 1.308,9 8,1 43,0 77,5 82,2 1,0 NL 16.486,6 33.873 486,7 4,9 48,4 78,1 82,5 0,0 PL PT 38.135,9 10.627,3 312.685 91.906 122,0 115,6 0,5 0,9 40,7 48,7 71,0 75,9 79,8 82,2 1998 1999 2000 2001 2002 2003 2004 2005 2006 2007 <strong>2008</strong> ‰ Ελλάδα - <strong>Greece</strong> ΕΕ-27 - EU 27 RO 21.498,6 237.500 90,5 -1,4 43,1 69,7 76,9 Πληθυσµός– Population (1998=100) SE 9.256,3 410.934 22,5 8,0 52,2 79,0 83,1 105,0 SI 2.032,4 20.273 100,2 10,9 42,9 74,7 82,0 104,0 SK UK 5.412,3 61.634,6 49.035 243.820 110,4 252,8 2,1 7,2 38,4 50,7 70,6 78,4 103,0 HR 4.435,1 56.594 78,4 -0,3 48,6 72,3 79,3 TR 71.517,1 780.580 91,6 13,1 50,4 70,1 73,9 US 307.212,1 9.631.418 31,9 11,1 49,3 75,7 80,7 JP 127.078,7 377.835 336,3 -1,6 55,5 78,8 85,6 1 Στοιχεία 2006 / 2006 Data 1 77,3 1 83,3 1 81,7 1,3 1,1 102,0 101,0 100,0 99,0 (1998=100) 1998 1999 2000 2001 2002 2003 2004 2005 2006 2007 <strong>2008</strong> 2009 Ελλάδα - <strong>Greece</strong> ΕΕ-27 - EU 27 Πηγή / Source: Eurostat <strong>Greece</strong> <strong>in</strong> <strong>Figures</strong> 2010 www.icap.gr
- Page 2 and 3:
www.findbiz.gr Η Ελλάδα σε
- Page 4 and 5:
www.findbiz.gr Η Ελλάδα σε
- Page 6 and 7:
www.findbiz.gr Η Ελλάδα σε
- Page 8 and 9:
www.findbiz.gr Η Ελλάδα σε
- Page 10 and 11:
www.findbiz.gr Η Ελλάδα σε
- Page 12 and 13:
www.findbiz.gr Η Ελλάδα σε
- Page 14 and 15:
www.findbiz.gr Η Ελλάδα σε
- Page 16 and 17:
www.findbiz.gr Η Ελλάδα σε
- Page 18 and 19:
www.findbiz.gr Η Ελλάδα σε
- Page 20 and 21:
www.findbiz.gr Η Ελλάδα σε
- Page 22 and 23:
www.findbiz.gr Η Ελλάδα σε
- Page 24 and 25:
www.findbiz.gr Η Ελλάδα σε
- Page 26 and 27:
www.findbiz.gr Η Ελλάδα σε
- Page 28 and 29:
www.findbiz.gr Η Ελλάδα σε
- Page 30 and 31:
www.findbiz.gr Η Ελλάδα σε
- Page 32 and 33:
www.findbiz.gr Η Ελλάδα σε
- Page 34 and 35:
www.findbiz.gr Η Ελλάδα σε
- Page 36 and 37:
www.findbiz.gr Η Ελλάδα σε
- Page 38 and 39:
www.findbiz.gr Η Ελλάδα σε
- Page 40 and 41:
www.findbiz.gr Η Ελλάδα σε
- Page 42 and 43:
www.findbiz.gr Η Ελλάδα σε
- Page 44 and 45:
www.findbiz.gr Η Ελλάδα σε
- Page 46 and 47:
45 Κλάδος Sector Β.Ι.12 Γ
- Page 48 and 49:
www.findbiz.gr Η Ελλάδα σε
- Page 50 and 51:
www.findbiz.gr Η Ελλάδα σε
- Page 52 and 53:
www.findbiz.gr Η Ελλάδα σε
- Page 54 and 55:
www.findbiz.gr Η Ελλάδα σε
- Page 56 and 57:
www.findbiz.gr Η Ελλάδα σε
- Page 58 and 59:
www.findbiz.gr Η Ελλάδα σε
- Page 60 and 61:
www.findbiz.gr Η Ελλάδα σε
- Page 62 and 63:
www.findbiz.gr Η Ελλάδα σε
- Page 64 and 65:
www.findbiz.gr Η Ελλάδα σε
- Page 66 and 67:
www.findbiz.gr Η Ελλάδα σε
- Page 68 and 69:
www.findbiz.gr Η Ελλάδα σε
- Page 70 and 71:
www.findbiz.gr Η Ελλάδα σε
- Page 72 and 73:
71 Β.ΙΙΙ.10 Μεταποίησ
- Page 74 and 75:
73 Κλάδος Sector Β.ΙΙΙ.12
- Page 76 and 77:
75 Β.ΙΙΙ.14 Μεταποίησ
- Page 78 and 79:
www.findbiz.gr Η Ελλάδα σε
- Page 80 and 81:
www.findbiz.gr Η Ελλάδα σε
- Page 82 and 83:
www.findbiz.gr Η Ελλάδα σε
- Page 84 and 85:
www.findbiz.gr Η Ελλάδα σε
- Page 86 and 87:
www.findbiz.gr Η Ελλάδα σε
- Page 88 and 89:
www.findbiz.gr Η Ελλάδα σε
- Page 90 and 91:
www.findbiz.gr Η Ελλάδα σε
- Page 92 and 93:
www.findbiz.gr Η Ελλάδα σε
- Page 94 and 95:
www.findbiz.gr Η Ελλάδα σε
- Page 96 and 97:
www.findbiz.gr Η Ελλάδα σε
- Page 98 and 99:
www.findbiz.gr Η Ελλάδα σε
- Page 100 and 101:
www.findbiz.gr Η Ελλάδα σε
- Page 102 and 103:
www.findbiz.gr Η Ελλάδα σε
- Page 104 and 105:
250+ 77,4% www.findbiz.gr Η Ελλ
- Page 106 and 107:
www.findbiz.gr Η Ελλάδα σε
- Page 108 and 109:
www.findbiz.gr Η Ελλάδα σε
- Page 110 and 111:
www.findbiz.gr Η Ελλάδα σε
- Page 112 and 113:
www.findbiz.gr Η Ελλάδα σε
- Page 114 and 115:
www.findbiz.gr Η Ελλάδα σε
- Page 116 and 117:
www.findbiz.gr Η Ελλάδα σε
- Page 118 and 119:
www.findbiz.gr Η Ελλάδα σε
- Page 120 and 121:
www.findbiz.gr Η Ελλάδα σε
- Page 122 and 123:
www.findbiz.gr Η Ελλάδα σε
- Page 124 and 125:
www.findbiz.gr Η Ελλάδα σε
- Page 126 and 127:
250+ 28,7% www.findbiz.gr Η Ελλ
- Page 128 and 129:
www.findbiz.gr Η Ελλάδα σε
- Page 130 and 131:
www.findbiz.gr Η Ελλάδα σε
- Page 132 and 133:
131 B.VI.10 Εµπόριο: Η Σύ
- Page 134 and 135:
133 Κλάδος Sector B.VI.14 Ε
- Page 136 and 137:
www.findbiz.gr Η Ελλάδα σε
- Page 138 and 139:
www.findbiz.gr Η Ελλάδα σε
- Page 140 and 141:
www.findbiz.gr Η Ελλάδα σε
- Page 142 and 143:
www.findbiz.gr Η Ελλάδα σε
- Page 144 and 145:
www.findbiz.gr Η Ελλάδα σε
- Page 146 and 147:
www.findbiz.gr Η Ελλάδα σε
- Page 148 and 149:
www.findbiz.gr Η Ελλάδα σε
- Page 150 and 151:
www.findbiz.gr Η Ελλάδα σε
- Page 152 and 153:
www.findbiz.gr Η Ελλάδα σε
- Page 154 and 155:
www.findbiz.gr Η Ελλάδα σε
- Page 156 and 157:
www.findbiz.gr Η Ελλάδα σε
- Page 158 and 159:
www.findbiz.gr Η Ελλάδα σε
- Page 160 and 161:
159 Κλάδος Sector B.VIII.12
- Page 162 and 163:
www.findbiz.gr Η Ελλάδα σε
- Page 164 and 165:
www.findbiz.gr Η Ελλάδα σε
- Page 166 and 167:
www.findbiz.gr Η Ελλάδα σε
- Page 168 and 169:
www.findbiz.gr Η Ελλάδα σε
- Page 170 and 171:
www.findbiz.gr Η Ελλάδα σε
- Page 172 and 173:
www.findbiz.gr Η Ελλάδα σε
- Page 174 and 175:
www.findbiz.gr Η Ελλάδα σε
- Page 176 and 177:
www.findbiz.gr Η Ελλάδα σε
- Page 178 and 179:
www.findbiz.gr Η Ελλάδα σε
- Page 180 and 181:
www.findbiz.gr Η Ελλάδα σε
- Page 182 and 183:
www.findbiz.gr Η Ελλάδα σε
- Page 184 and 185:
www.findbiz.gr Η Ελλάδα σε
- Page 186 and 187:
www.findbiz.gr Η Ελλάδα σε
- Page 188 and 189:
www.findbiz.gr Η Ελλάδα σε
- Page 190 and 191: www.findbiz.gr Η Ελλάδα σε
- Page 192 and 193: www.findbiz.gr Η Ελλάδα σε
- Page 194 and 195: www.findbiz.gr Η Ελλάδα σε
- Page 196 and 197: www.findbiz.gr Η Ελλάδα σε
- Page 198 and 199: www.findbiz.gr Η Ελλάδα σε
- Page 200 and 201: www.findbiz.gr Η Ελλάδα σε
- Page 202 and 203: www.findbiz.gr Η Ελλάδα σε
- Page 204 and 205: www.findbiz.gr Η Ελλάδα σε
- Page 206 and 207: 205 B.X.10 Λοιπές Υπηρε
- Page 208 and 209: 207 Κλάδος Sector B.X.12 Λο
- Page 210 and 211: 209 B.X.14 Λοιπές Υπηρε
- Page 212 and 213: www.findbiz.gr Η Ελλάδα σε
- Page 214 and 215: www.findbiz.gr Η Ελλάδα σε
- Page 216 and 217: www.findbiz.gr Η Ελλάδα σε
- Page 218 and 219: www.findbiz.gr Η Ελλάδα σε
- Page 220 and 221: www.findbiz.gr Η Ελλάδα σε
- Page 222 and 223: www.findbiz.gr Η Ελλάδα σε
- Page 224 and 225: www.findbiz.gr Η Ελλάδα σε
- Page 226 and 227: www.findbiz.gr Η Ελλάδα σε
- Page 228 and 229: www.findbiz.gr Η Ελλάδα σε
- Page 230 and 231: www.findbiz.gr Η Ελλάδα σε
- Page 232 and 233: www.findbiz.gr Η Ελλάδα σε
- Page 234 and 235: www.findbiz.gr Η Ελλάδα σε
- Page 236 and 237: www.findbiz.gr Η Ελλάδα σε
- Page 238 and 239: www.findbiz.gr Η Ελλάδα σε
- Page 242 and 243: www.findbiz.gr Η Ελλάδα σε
- Page 244 and 245: www.findbiz.gr Η Ελλάδα σε
- Page 246 and 247: www.findbiz.gr Η Ελλάδα σε
- Page 248 and 249: www.findbiz.gr Η Ελλάδα σε
- Page 250 and 251: www.findbiz.gr Η Ελλάδα σε
- Page 252 and 253: www.findbiz.gr Η Ελλάδα σε
- Page 254 and 255: www.findbiz.gr Η Ελλάδα σε
- Page 256 and 257: www.findbiz.gr Η Ελλάδα σε