kinetic response of thermosetting adhesive systems to heat
kinetic response of thermosetting adhesive systems to heat
kinetic response of thermosetting adhesive systems to heat

You also want an ePaper? Increase the reach of your titles
YUMPU automatically turns print PDFs into web optimized ePapers that Google loves.
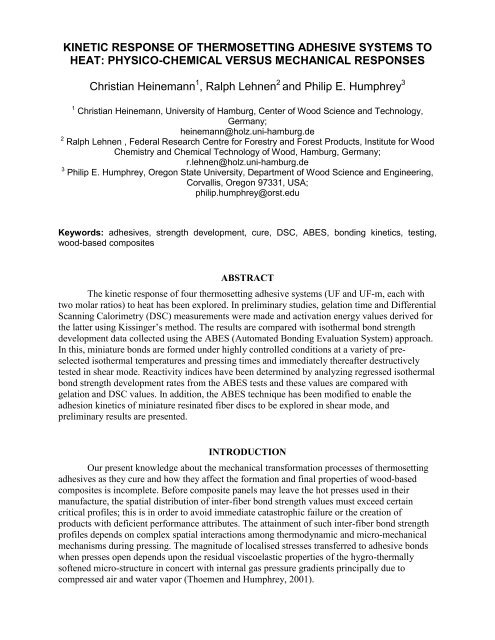
KINETIC RESPONSE OF THERMOSETTING ADHESIVE SYSTEMS TO<br />
HEAT: PHYSICO-CHEMICAL VERSUS MECHANICAL RESPONSES<br />
Christian Heinemann 1 , Ralph Lehnen 2 and Philip E. Humphrey 3<br />
1 Christian Heinemann, University <strong>of</strong> Hamburg, Center <strong>of</strong> Wood Science and Technology,<br />
Germany;<br />
heinemann@holz.uni-hamburg.de<br />
2 Ralph Lehnen , Federal Research Centre for Forestry and Forest Products, Institute for Wood<br />
Chemistry and Chemical Technology <strong>of</strong> Wood, Hamburg, Germany;<br />
r.lehnen@holz.uni-hamburg.de<br />
3 Philip E. Humphrey, Oregon State University, Department <strong>of</strong> Wood Science and Engineering,<br />
Corvallis, Oregon 97331, USA;<br />
philip.humphrey@orst.edu<br />
Keywords: <strong>adhesive</strong>s, strength development, cure, DSC, ABES, bonding <strong>kinetic</strong>s, testing,<br />
wood-based composites<br />
ABSTRACT<br />
The <strong>kinetic</strong> <strong>response</strong> <strong>of</strong> four <strong>thermosetting</strong> <strong>adhesive</strong> <strong>systems</strong> (UF and UF-m, each with<br />
two molar ratios) <strong>to</strong> <strong>heat</strong> has been explored. In preliminary studies, gelation time and Differential<br />
Scanning Calorimetry (DSC) measurements were made and activation energy values derived for<br />
the latter using Kissinger’s method. The results are compared with isothermal bond strength<br />
development data collected using the ABES (Au<strong>to</strong>mated Bonding Evaluation System) approach.<br />
In this, miniature bonds are formed under highly controlled conditions at a variety <strong>of</strong> preselected<br />
isothermal temperatures and pressing times and immediately thereafter destructively<br />
tested in shear mode. Reactivity indices have been determined by analyzing regressed isothermal<br />
bond strength development rates from the ABES tests and these values are compared with<br />
gelation and DSC values. In addition, the ABES technique has been modified <strong>to</strong> enable the<br />
adhesion <strong>kinetic</strong>s <strong>of</strong> miniature resinated fiber discs <strong>to</strong> be explored in shear mode, and<br />
preliminary results are presented.<br />
INTRODUCTION<br />
Our present knowledge about the mechanical transformation processes <strong>of</strong> <strong>thermosetting</strong><br />
<strong>adhesive</strong>s as they cure and how they affect the formation and final properties <strong>of</strong> wood-based<br />
composites is incomplete. Before composite panels may leave the hot presses used in their<br />
manufacture, the spatial distribution <strong>of</strong> inter-fiber bond strength values must exceed certain<br />
critical pr<strong>of</strong>iles; this is in order <strong>to</strong> avoid immediate catastrophic failure or the creation <strong>of</strong><br />
products with deficient performance attributes. The attainment <strong>of</strong> such inter-fiber bond strength<br />
pr<strong>of</strong>iles depends on complex spatial interactions among thermodynamic and micro-mechanical<br />
mechanisms during pressing. The magnitude <strong>of</strong> localised stresses transferred <strong>to</strong> <strong>adhesive</strong> bonds<br />
when presses open depends upon the residual viscoelastic properties <strong>of</strong> the hygro-thermally<br />
s<strong>of</strong>tened micro-structure in concert with internal gas pressure gradients principally due <strong>to</strong><br />
compressed air and water vapor (Thoemen and Humphrey, 2001).
Over the past two decades or so various studies have been conducted with a view <strong>to</strong><br />
inferring <strong>adhesive</strong> cure during composite hot pressing processes. Methods <strong>of</strong> physico-chemical<br />
analysis (such as DSC, DTA and DMA) have been used <strong>to</strong> explore the responsiveness <strong>of</strong><br />
<strong>adhesive</strong> <strong>systems</strong> <strong>to</strong> <strong>heat</strong>. Derived activation energy and tan-delta values (δ) have been used <strong>to</strong><br />
gauge the reactivity <strong>of</strong> <strong>adhesive</strong>s at different stages <strong>of</strong> cure (Mizumachi, 1973; Geimer et al.,<br />
1990). Similarly, mechanical tests have been successfully used <strong>to</strong> explore isothermal bond<br />
strength accumulation by forming and testing miniature lap-shear bonds under a range <strong>of</strong> highly<br />
controlled temperature and time combinations (Humphrey and Ren, 1989; Humphrey and<br />
Zavala, 1989; Humphrey, 1991; Wang et al., 1995; Humphrey, 1999; Heinemann 2002).<br />
Differential Scanning Calorimetry (DSC) and two mechanical means <strong>of</strong> exploring the <strong>kinetic</strong>s <strong>of</strong><br />
<strong>thermosetting</strong> <strong>adhesive</strong> cure (based on the ABES approach), and how the results pertain <strong>to</strong> biocomposite<br />
production, are presented and compared here.<br />
EXPERIMENTAL METHODS AND RESULTS<br />
Specimen preparation and properties<br />
Four commercially available urea formaldehyde (UF) and melamine-fortified UF (UF-m)<br />
<strong>adhesive</strong> <strong>systems</strong> with differing molar ratios <strong>of</strong> urea <strong>to</strong> formaldehyde (F:U) and melamine<br />
content (Table 1) were tested. After the addition <strong>of</strong> 1% hardener (Ammonium nitrate - NH4NO3),<br />
the solids content was adjusted <strong>to</strong> 60% by adding distilled water. Differences in viscosity among<br />
the four formulations were minor.<br />
Table 1 – Properties <strong>of</strong> <strong>thermosetting</strong> <strong>adhesive</strong>s used as test<br />
specimens in this study.<br />
<strong>adhesive</strong><br />
system<br />
molar ratio<br />
F:U<br />
melamine<br />
content<br />
gelation<br />
time [s]<br />
UF#2 High - 68<br />
UF#3 Low - 65<br />
UFm#4 High High 145<br />
UFm#5 Low Low 97<br />
Differential Scanning Calorimetry (DSC)<br />
Differential scanning calorimetry was employed as one means <strong>of</strong> characterising the<br />
responsiveness <strong>of</strong> the <strong>adhesive</strong>s <strong>to</strong> <strong>heat</strong>. Adhesive sample <strong>heat</strong>ing-rates between 1.0 and<br />
4.0°K/min were selected in order <strong>to</strong> maximize detection <strong>of</strong> the exothermic reaction peaks, rather<br />
than using rates that correspond <strong>to</strong> any specific <strong>heat</strong>ing cycle that occurs in panels during<br />
pressing (which are almost always faster, non-uniform, and vary with position).<br />
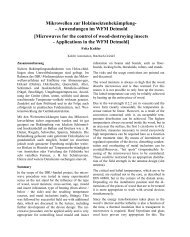
A typical set <strong>of</strong> curves for the tested <strong>adhesive</strong>s is presented as Figure 1. A distinct single<br />
peak is evident for the UF samples (<strong>adhesive</strong> <strong>systems</strong> UF#2 and UF#3), whereas the melaminemodified<br />
specimens (<strong>systems</strong> UF-m#4 and UF-m#5) show a slight shoulder before reaching their<br />
maxima. Data for the UF-m samples suggest that higher temperatures are necessary <strong>to</strong> reach the<br />
exothermic peak, and this indicates a slower polymerization reaction that is probably due <strong>to</strong> an<br />
increased buffer capacity <strong>of</strong> the melamine. Additionally, a reduced peak <strong>of</strong> the exothermic<br />
reaction is evident, based on the properties <strong>of</strong> the aromatic ring structure <strong>of</strong> the melamine.
Exothermic Heat [0,5 W/g]<br />
UF#2<br />
UF#3<br />
UFm#4<br />
UFm#5<br />
30 40 50 60 70 80 90 100 110 120 130 140 150 160 170 180 190<br />
Temperature [°C]<br />
Lab: METTLER<br />
Figure 1 - DSC curves obtained with a 2°K/min <strong>heat</strong>ing rate for samples weighing 10 mg.<br />
The relationship between temperature and the rate at which a first-order reaction proceeds<br />
and temperature is commonly described using the Arrhenius Equation (Eqn. 1):<br />
ln k = ln A – EA/RT (1)<br />
where k is the rate coefficient (kJ/mol), A is the pre-exponential fac<strong>to</strong>r, R is the universal<br />
gas constant (8,314*10 -3 kJ*mol -1 *K -1 ) and T is the absolute temperature (°K).<br />
In the present DSC experiments, activation energy values have been extracted by<br />
analyzing temperature peaks measured for runs conducted using three different <strong>heat</strong>ing rates <strong>of</strong><br />
1°K/min, 2°K/min and 4°K/min following the method <strong>of</strong> Kissinger (Kissinger 1957).<br />
Au<strong>to</strong>mated Bonding Evaluation System (ABES)<br />
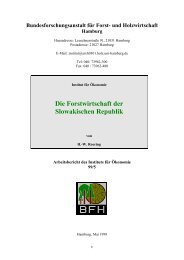
The ABES technique may be used <strong>to</strong> characterize the mechanical <strong>response</strong> (bond strength<br />
in this case) <strong>of</strong> <strong>adhesive</strong> <strong>systems</strong> <strong>to</strong> a wide range <strong>of</strong> parameters; the influence <strong>of</strong> temperature was<br />
<strong>of</strong> concern in the present investigation. The test arrangement is shown conceptually as Figure 2<br />
and the bond forming and testing zone <strong>of</strong> the ABES instrument as Figure 3.<br />
Figure 2 - A schematic representation <strong>of</strong> the ABES approach.
Figure 3, A close-up <strong>of</strong> the bond forming and testing zone <strong>of</strong> ABES (the cooling head is retracted and<br />
was not used in the reported research)<br />
Adhesive was metered on<strong>to</strong> the end-most 5 mm <strong>of</strong> pairs <strong>of</strong> Maple veneer strips measuring<br />
0.7 mm thick, 20 mm wide and 117 mm in length (conditioned <strong>to</strong> 8 % moisture content).<br />
Adherend pairs where mounted in ABES with an overlapping area <strong>of</strong> 100 mm² and pressed<br />
<strong>to</strong>gether at 1.2 N/mm². Bonds were pressed at temperatures <strong>of</strong> 95°C, 105°C, 115°C and 125°C.<br />
The wood was especially thin in order <strong>to</strong> hasten the transfer <strong>of</strong> <strong>heat</strong> from the precisely<br />
temperature-controlled pressing blocks <strong>to</strong> the bonding interface. In this way, near-isothermal<br />
<strong>adhesive</strong> conditions (±1°C) were attained within 12 seconds following press closure. Measured<br />
bond strength accumulation for all pressing times in excess <strong>of</strong> 12 seconds could therefore be<br />
attributed <strong>to</strong> the target temperature. After each pre-selected pressing time, bond strength was<br />
tested almost instantaneously in shear mode (ABES is digitally controlled and pneumatically<br />
driven). All bonds were therefore tested while still at the forming temperature. The effect <strong>of</strong><br />
testing temperature on the strength <strong>of</strong> variously cured bonds (where the cooling head is activated<br />
immediately following press-opening and before bond pulling) is the subject <strong>of</strong> a separate study<br />
(Kim and Humphrey, 2002; Kim, 2002). Further details <strong>of</strong> the ABES testing approach, including<br />
issues <strong>of</strong> shear stress-correction, <strong>heat</strong> transfer, cooling, and bond analysis may be found in a<br />
publication (Humphrey, 1999).<br />
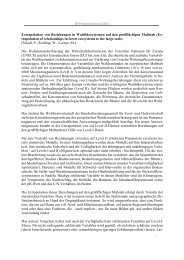
Temperature effects on bond strength development: A typical family <strong>of</strong> isothermal bond<br />
strength development curves is shown in Figure 4a (for formulation #3.) It is convenient here <strong>to</strong><br />
sub-divide the curves in<strong>to</strong> three portions. During the first section no significant bond strength<br />
occurs (although tack may be quantified when the high-sensitivity mode <strong>of</strong> ABES is activated.)<br />
Once bonding begins, bond strengths rise at a near-constant rate, before, in the third stage, the<br />
increase <strong>of</strong> bond strength decreases and the curves level <strong>of</strong>f until they reach their maximum<br />
values. The initial delay in the onset <strong>of</strong> bond strength development may be caused by a short<br />
period <strong>of</strong> increasing temperature combined with a loss <strong>of</strong> energy due <strong>to</strong> evaporation <strong>of</strong> water<br />
within the glue line. The <strong>adhesive</strong> may also still be in the fully liquid state (and even sustain a<br />
temporary decrease in viscosity upon initial temperature rise.) The second and near-linear stage<br />
is likely directly attributable <strong>to</strong> the polymerization reaction <strong>of</strong> the <strong>adhesive</strong> <strong>systems</strong> by chainextension<br />
and cross-linking processes.
It is the regressed gradient <strong>of</strong> this dominant portion <strong>of</strong> the data that will be used here <strong>to</strong> derive<br />
reactivity indices and activation energy values for the <strong>adhesive</strong> <strong>systems</strong>. The decreased-rate stage<br />
may be due both <strong>to</strong> a slowing <strong>of</strong> the polymerization reaction <strong>of</strong> the <strong>adhesive</strong> combined with the<br />
onset <strong>of</strong> cohesive failure <strong>of</strong> the adherend on a micro-scale. The adherends begin <strong>to</strong> fail by fiber<br />
pull-out and therefore ultimate strength values <strong>of</strong> the fiber-<strong>adhesive</strong> interface itself may be<br />
masked. Taking the slope <strong>of</strong> the linear section <strong>of</strong> each bond strength curve from Figure 4a<br />
(excluding the initial delay and the leveling-<strong>of</strong>f section at advanced pressing times) the regressed<br />
isothermal bond strength rate can be plotted versus temperature (Figure 4b).<br />
Shear Strength [N/mm²]<br />
5,0<br />
4,0<br />
3,0<br />
2,0<br />
1,0<br />
125°C<br />
115°C<br />
105°C<br />
95°C<br />
0,0<br />
0 60 120 180<br />
Pressing Time [s]<br />
240 300 360<br />
0<br />
90 100 110<br />
Pressing Temperature [°C]<br />
120 130<br />
a) b)<br />
Figure 4. a) A representative family <strong>of</strong> bond strength development curves for four temperature levels (for<br />
<strong>adhesive</strong> encoded UF#3), and b) Regressed isothermal bond strength development rate (for the middle<br />
linear stage) versus temperature for all four <strong>adhesive</strong> <strong>systems</strong>.<br />
Isothermal Shear Strength<br />
Development [kPa/s]<br />
240<br />
180<br />
120<br />
60<br />
UF #2 UF #3 UFm #4 UFm #5<br />
Repetition <strong>of</strong> the above analysis for all four <strong>adhesive</strong> <strong>systems</strong> enables differences in their<br />
responsiveness <strong>to</strong> temperature <strong>to</strong> be explored. These differences are evident in Fig 4b. The higher<br />
formaldehyde content appears <strong>to</strong> correspond with faster bonding rates, while increasing amounts<br />
<strong>of</strong> melamine reduces the rates. For each <strong>adhesive</strong> system a linear correlation can be derived by<br />
plotting the natural logarithm <strong>of</strong> the regressed isothermal bond strength development rate against<br />
the reciprocal <strong>of</strong> absolute temperature (Figure 5).<br />
ln k [kPa/s]<br />
5,5<br />
5,0<br />
4,5<br />
4,0<br />
3,5<br />
3,0<br />
UF #2 UF #3 UFm #4 UFm #5<br />
2,5<br />
2,50 2,55 2,60 2,65 2,70 2,75<br />
1 / absolute Temperatur [°K*10 -3 ]<br />
Figure 5. ABES-derived Arrhenius plots (natural logarithm <strong>of</strong> regressed bond strength<br />
rate vs. the reciprocal <strong>of</strong> absolute temperature) for each <strong>of</strong> the four <strong>adhesive</strong><br />
<strong>systems</strong>.
The slope <strong>of</strong> each regressed line reflects the <strong>adhesive</strong>s' reactivity; the steeper the slope the<br />
higher the <strong>adhesive</strong>’s reactivity. Humphrey and Ren (1989) coined the expression 'reactivity<br />
index' (Ri) <strong>to</strong> describe the bonding <strong>kinetic</strong>s <strong>of</strong> <strong>adhesive</strong> <strong>systems</strong>:<br />
Ri = -T * ln A (2)<br />
where T is the absolute Temperature (°K) and A is the rate <strong>of</strong> bond strength development<br />
(kPa*s -1 ).<br />
Linearity <strong>of</strong> the plot suggests that the bond strength development rate can be described by<br />
a first order chemical reaction. This analytical method is usually applied <strong>to</strong> chemical reactions<br />
but might be transferred <strong>to</strong> evaluate mechanical behaviour <strong>of</strong> <strong>thermosetting</strong> <strong>adhesive</strong>s. In order <strong>to</strong><br />
obtain activation energy values for the tested <strong>adhesive</strong> <strong>systems</strong> the reactivity index can be<br />
multiplied by the universal gas constant (R). Derived reactivity indices and activation energy<br />
values are presented in Table 2.<br />
Table 2. Reactivity index and activation energy values <strong>of</strong> for the four<br />
<strong>systems</strong> investigated.<br />
Adhesive System Reactivity Index<br />
Activation Energy<br />
[kJ/mol]<br />
ABES ABES DSC<br />
UF#2 8,70 72,3 95,5<br />
UF#3 7,68 63,9 85,0<br />
UFm#4 8,19 68.1 92,8<br />
UFm#5 7,41 61,6 84,0<br />
The activation energies <strong>of</strong> the tested <strong>adhesive</strong> <strong>systems</strong> from Table 2 determined with<br />
ABES and DSC might be compared by comparing relative ratios. Knowing that the <strong>adhesive</strong><br />
system UF#2 shows the highest activation energy values, these values are set <strong>to</strong> equal a ratio <strong>of</strong><br />
'1' for ABES and DSC separately. In Figure 6 the ratios <strong>of</strong> <strong>adhesive</strong> <strong>systems</strong> UF#3, UFm#4 and<br />
UFm#5 show good conformity when related <strong>to</strong> UF#2. Overall, activation energy values from the<br />
DSC method show slightly lower differences than do those determined with ABES. However,<br />
the determination <strong>of</strong> key ratios with DSC and ABES might be a promising <strong>to</strong>ol <strong>to</strong> compare<br />
<strong>kinetic</strong> <strong>response</strong> <strong>of</strong> different <strong>adhesive</strong> <strong>systems</strong> <strong>to</strong> <strong>heat</strong>. Indeed, the results suggest that the ABES<br />
approach may prove more sensitive <strong>to</strong> small differences in <strong>adhesive</strong> formulation than DSC.<br />
Further, these limited results suggest that gelation time may be an unreliable predic<strong>to</strong>r <strong>of</strong><br />
subsequent bonding performance (after gelation).
Activation Energy Index<br />
1,00<br />
0,95<br />
0,90<br />
0,85<br />
ABES<br />
DSC<br />
Gelation time<br />
(2,09) (1,46)<br />
UF#2 UF#3 UFm#4<br />
UFm#5<br />
Adhesive System<br />
Figure 6. Ratios <strong>of</strong> activation energy <strong>of</strong> the <strong>adhesive</strong> <strong>systems</strong> derived from DSC, ABES<br />
and gelation time methods on a basis <strong>of</strong> reactivities for <strong>adhesive</strong> #2.<br />
Composites testing system (ComTes)<br />
Design and testing procedure:- ABES has been modified in order <strong>to</strong> enable the combined<br />
effects <strong>of</strong> <strong>adhesive</strong> and fiber network characteristics on bonding <strong>of</strong> wood-based composite<br />
materials <strong>to</strong> be explored. Resinated (but uncured) miniature fiber discs (17.5 mm in diameter and<br />
9-mm in thickness) can be pressed under controlled conditions <strong>of</strong> temperature and tested in shear<br />
mode perpendicular <strong>to</strong> the forming direction. For this purpose, after forming, two samples are<br />
pressed and tested simultaneously. Aspects <strong>of</strong> the system are shown as Figure. 7. Two circular<br />
temperature-controlled pressing heads (�) act uniaxially on the outer surfaces <strong>of</strong> the samples,<br />
while and one angular block (�) in the center with inserted cartridge <strong>heat</strong>ers are used <strong>to</strong> transfer<br />
<strong>heat</strong> and load on<strong>to</strong> the samples surfaces. To impede passive spreading <strong>of</strong> the samples, the fiber<br />
discs are peripherally constrained by PTFE (Teflon) cylinders (�) that are pneumatically driven<br />
back prior <strong>to</strong> testing. Small aluminum discs are glued simultaneously on<strong>to</strong> the discs’ surfaces<br />
with cyanoacrylate <strong>adhesive</strong> <strong>to</strong> transfer shear forces from the shear bar (�) in<strong>to</strong> the samples.<br />
Usually, the samples fail in the core layer <strong>of</strong> the 3 mm thick samples because <strong>of</strong> the slightly<br />
delayed temperature increase in this plane.<br />
1<br />
1<br />
2<br />
fiber discs<br />
Figure 7 - Overview (left) and detail (right) <strong>of</strong> the Composites Testing System.<br />
4<br />
4<br />
3
Temperature effects on internal mat characteristics during testing<br />
In order <strong>to</strong> resolve the role <strong>of</strong> the <strong>adhesive</strong> in affecting the shear strength <strong>of</strong> compressed<br />
fiber samples, a number <strong>of</strong> fiber samples were compressed in the absence <strong>of</strong> <strong>adhesive</strong>, and the<br />
results compared with corresponding samples pressed with <strong>adhesive</strong>. Clearly, the interplay <strong>of</strong><br />
mechanisms which influence the structure and properties <strong>of</strong> compressed fiber networks is highly<br />
complex; it is beyond the scope <strong>of</strong> the present discussion and will be the subject <strong>of</strong> future<br />
publications. Such mechanisms are, however, assuredly influenced by fiber type and<br />
juxtaposition, transient moisture and temperature conditions, and the magnitude and duration <strong>of</strong><br />
applied compressive stress.<br />
Figure 8 shows representative shear resistance values <strong>of</strong> non-resinated miniature fiber<br />
discs. Pressing temperature appears <strong>to</strong> affect measured values. This is no doubt attributable <strong>to</strong> the<br />
interplay <strong>of</strong> mechanisms listed above. Shear resistance does appear <strong>to</strong> decrease with increasing<br />
pressing temperature, while almost no influence can be detected with increasing pressing time.<br />
Under pressing conditions <strong>of</strong> low temperature and high specimen density, a decreasing trend <strong>of</strong><br />
shear resistance is, however, evident; this might be attributable <strong>to</strong> thermal s<strong>of</strong>tening <strong>of</strong> cell wall<br />
material.<br />
Shear Strength [N/mm²]<br />
1,2<br />
0,8<br />
0,4<br />
0,0<br />
125°C; 600kg/m³<br />
125°C; 500kg/m³<br />
100°C; 400kg/m³<br />
125°C; 400kg/m³<br />
150°C; 400kg/m³<br />
0 20 40 60<br />
Pressing Time [s]<br />
80 100 120<br />
Figure 8. Shear Strength <strong>of</strong> non-resinated miniature fiber discs pressed at different<br />
temperatures and densities.<br />
Temperature Effects On Shear Strength Development Of Resinated Samples<br />
The shear strength development <strong>of</strong> resinated miniature fiber discs pressed at 100°C,<br />
125°C and 150°C are presented in Figure 9. These initial results show a strong correlation<br />
between measured shear strength and pressing time (hollow symbols on Fig. 9). Solid symbols in<br />
Fig. 9 are data generated by <strong>of</strong>fsetting the non-resinated shear strength values from the<br />
corresponding resinated values. As one may expect, inferred <strong>adhesive</strong> shear strength values<br />
increase with increasing pressing temperature and pressing time.
Shear Strength [N/mm²]<br />
2,0<br />
1,5<br />
1,0<br />
0,5<br />
150°C 125°C 100°C<br />
0,0<br />
0 50 100 150 200 250<br />
Pressing Time [s]<br />
Figure 9 - Shear strength development <strong>of</strong> resinated fiber discs at 400 kg/m³ (hollow dots<br />
are measured data while filled ones are the inferred <strong>adhesive</strong> contribution <strong>to</strong> shear<br />
strength)<br />
CONCLUSIONS<br />
Two methods, one physico-chemical (DSC) and one mechanical (ABES), have been<br />
presented <strong>to</strong> characterize <strong>adhesive</strong> <strong>systems</strong> (UF and UF-m) with different molar ratios and<br />
different melamine content. The <strong>kinetic</strong> <strong>response</strong> <strong>of</strong> <strong>thermosetting</strong> <strong>adhesive</strong>s <strong>to</strong> <strong>heat</strong> has been<br />
described in terms <strong>of</strong> reactivity indices and activation energy values (following Kissinger’s<br />
method for the former). With the ABES approach, <strong>thermosetting</strong> <strong>adhesive</strong>s have been cured at<br />
different temperatures (95°C-125°C) and subsequently destructively tested in shear mode.<br />
Veneer strips are used as wooden adherends. The reactivity index <strong>of</strong> the <strong>adhesive</strong> <strong>systems</strong> have<br />
been determined by plotting the natural logarithm <strong>of</strong> regressed isothermal bonding rates against<br />
the reciprocal <strong>of</strong> absolute temperature. Taking activation energy indices <strong>of</strong> all tested <strong>adhesive</strong>s a<br />
satisfying conformity can be seen when comparing ABES and DSC.<br />
In the second part <strong>of</strong> the study, a method has been summarized which may be used <strong>to</strong><br />
determine bond strength development <strong>of</strong> fibrous composite material. Miniature MDF-like fiber<br />
discs have been formed and subsequently tested in shear mode. Initial results are encouraging:<br />
resinated wood fibrous material pressed under controlled conditions <strong>of</strong> temperature, load and<br />
density have been presented. Internal mat characteristics have <strong>to</strong> be addressed when analyzing<br />
absolute strength values. Compared <strong>to</strong> ABES, which is a reliable method <strong>to</strong> determine strength <strong>of</strong><br />
partially cured bonds, the modified ABES approach makes it possible <strong>to</strong> explore the micromechanical<br />
behavior <strong>of</strong> resinated wood fiber mats.
REFERENCES<br />
Atkins, P.W. (1986): Physical Chemistry. Oxford University Press<br />
Bol<strong>to</strong>n, A.J., P.E. Humphrey, and P.K. Kavvouras (1989): The hot pressing <strong>of</strong> dry-formed woodbased<br />
composites. Part VI. The importance <strong>of</strong> stresses in the pressed mattress and their<br />
relevance <strong>to</strong> the minimization <strong>of</strong> pressing time and the variability <strong>of</strong> board properties.<br />
Holzforschung, 43 (6), pp. 406 - 410.<br />
Denisov, O.B. (1978): Die Verklebung der Holzpartikeln bei der Heißpressung von Spanplatten<br />
aus Holz. Holztechnologie, 19 (3), pp. 139 - 141.<br />
Geimer, R.L.; Follensbee, R.A.; Christiansen, A.W.; Koutsky, J.A.; Myers, G.E. (1990): Resin<br />
Characterization. In: Proceedings <strong>of</strong> the 24 th Particleboard/Composite Materials<br />
Symposium Pullman (WA), pp. 65 - 83.<br />
Heinemann, C. (2002): Kinetic von Leimsystemen. In: Tagungsband zum Holzwerkst<strong>of</strong>f<br />
Workshop an der Universität Hamburg, pp. 15 - 20.<br />
Humphrey, P.E. (1997): The Bonding Speed <strong>of</strong> Adhesives: An Auomated Evaluation System. In:<br />
Proc. First European Panel Products Symposium. Llandudno, Wales. Pub.<br />
BioComposites Centre, UWB, Bangor. LL57 2UW, UK. 145-155<br />
Humphrey, P.E. (1996): Thermoplastic characteristics <strong>of</strong> partially cured <strong>thermosetting</strong> <strong>adhesive</strong><strong>to</strong>-wood<br />
bonds: the significance for wood-based composite manufacture. In: Proc. Third<br />
Pacific Rim BioBased Composites conference. Kyo<strong>to</strong>, Japan. Pub. Forest Research<br />
Institute, Univ. Kyo<strong>to</strong>.<br />
Humphrey, P.E. (1993): A device <strong>to</strong> test <strong>adhesive</strong> bonds. US Patent number 5,170,028 (and other<br />
patents). US Patent Office, Washing<strong>to</strong>n (DC), USA<br />
Humphrey, P. E. (1991): Pressing Issues in Panel Manufacture: Internal Behavior During<br />
Pressing and its Impact on Time Minimization, Properties and Pr<strong>of</strong>it. In: Proceedings <strong>of</strong><br />
the 25 th Particleboard/Composite Materials Symposium, Pullman (WA), pp. 99 - 108.<br />
Humphrey, P.E; Bol<strong>to</strong>n, A.J. (1979): Urea Formaldehyde Resin Bond Strength Development<br />
with Reference <strong>to</strong> Wood Particleboard Manufacture. Holzforschung, 33, pp. 129 - 133.<br />
Humphrey, P. E; Ren, S. (1989): Bonding Kinetics <strong>of</strong> Thermosetting Adhesive Systems used in<br />
Wood-based Composites: The combined Effect <strong>of</strong> Temperature and Moisture Content.<br />
Journal <strong>of</strong> Adhesion Science Technology, 3 (5), pp. 397 - 413.<br />
Humphrey, P. E; Zavala, D. (1989): A Technique <strong>to</strong> Evaluate the Bonding Reactivity <strong>of</strong><br />
Thermosetting Adhesives. Journal <strong>of</strong> testing and Evaluation, 17 (6), pp. 323 - 328.<br />
Kim, J. (2002): Doc<strong>to</strong>ral Thesis, Oregon State University, Department <strong>of</strong> Wood Science and<br />
Engineering.
Kissinger H.E. (1957): Reaction <strong>kinetic</strong>s in differential thermal analysis. Anal. Chem., 29 (11),<br />
pp. 1702 – 1706<br />
Mizumachi, H. (1973): Activation Energy <strong>of</strong> the Curing Reaction <strong>of</strong> Urea Resin in the Presence<br />
<strong>of</strong> Wood. Wood Science, 6 (1), pp. 14 – 18<br />
Schindlbauer, H.; Henkel, G.; Weiss, J.; Eichberger, W. (1976): Quantitative Untersuchungen<br />
zum Aushärtungsverhalten von Phenoplasten mittels differentialthermoanalytischer<br />
Methoden. Angew. Makromol. Chemie, 49, pp. 115 – 128<br />
Wang, X.-M.; Riedl, B.; Christiansen, A.W.; Geimer, R. L. (1995): The effects <strong>of</strong> temperature<br />
and humidity on phenol-formaldehyde resin bonding. Wood Science and Technology, 29,<br />
pp. 253 – 26<br />
Wang, X.-M.; Riedl, B.; Geimer, R. L.; Christiansen, A.W. (1996): Phenol-formaldehyde resin<br />
curing and bonding under dynamic condition. Wood Science and Technology, 30, pp. 423<br />
– 442.