Clase03 y 04-Diagrama de Nyquist-Estabilidad.pdf
Clase03 y 04-Diagrama de Nyquist-Estabilidad.pdf
Clase03 y 04-Diagrama de Nyquist-Estabilidad.pdf

You also want an ePaper? Increase the reach of your titles
YUMPU automatically turns print PDFs into web optimized ePapers that Google loves.
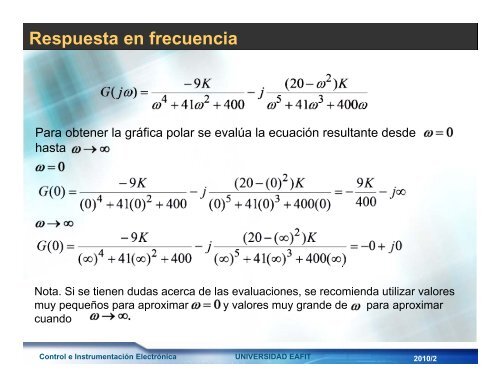
Respuesta en frecuencia<br />
Para obtener la gráfica polar se evalúa la ecuación resultante <strong>de</strong>s<strong>de</strong><br />
hasta<br />
Nota. Si se tienen dudas acerca <strong>de</strong> las evaluaciones, se recomienda utilizar valores<br />
muy pequeños para aproximar y valores muy gran<strong>de</strong> <strong>de</strong> para aproximar<br />
cuando<br />
Sistemas Control Embebidos e Instrumentación Electrónica UNIVERSIDAD EAFIT<br />
2010/2 2009/2