Indicadores Bibliométricos de la Actividad CientÃfica ... - ICONO
Indicadores Bibliométricos de la Actividad CientÃfica ... - ICONO
Indicadores Bibliométricos de la Actividad CientÃfica ... - ICONO

You also want an ePaper? Increase the reach of your titles
YUMPU automatically turns print PDFs into web optimized ePapers that Google loves.
Resultados<br />
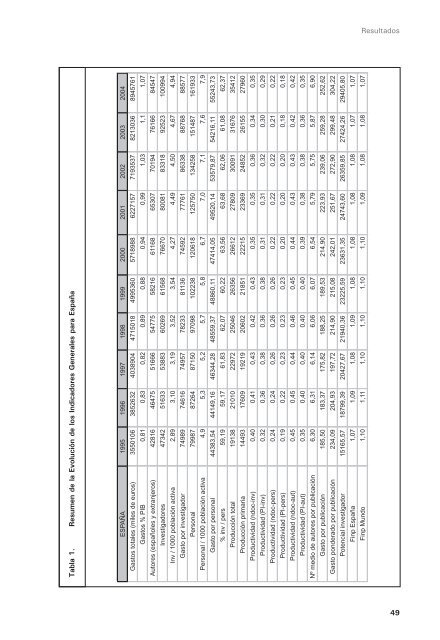
Tab<strong>la</strong> 1. Resumen <strong>de</strong> <strong>la</strong> Evolución <strong>de</strong> los <strong>Indicadores</strong> Generales para España<br />
ESPAÑA 1995 1996 1997 1998 1999 2000 2001 2002 2003 2004<br />
Gastos totales (miles <strong>de</strong> euros) 3550106 3852632 4038904 4715018 4995360 5718988 6227157 7193537 8213036 8945761<br />
Gastos % PIB 0,81 0,83 0,82 0,89 0,88 0,94 0,99 1,03 1,1 1,07<br />
Autores (españoles y extranjeros) 42816 46475 51666 54775 58216 61168 65307 70194 76166 84547<br />
Investigadores 47342 51633 53883 60269 61568 76670 80081 83318 92523 100994<br />
Inv / 1000 pob<strong>la</strong>ción activa 2,89 3,10 3,19 3,52 3,54 4,27 4,49 4,50 4,67 4,94<br />
Gasto por investigador 74989 74616 74957 78233 81136 74592 77761 86338 88768 88577<br />
Personal 79987 87264 87150 97098 102238 120618 125750 134258 151487 161933<br />
Personal / 1000 pob<strong>la</strong>ción activa 4,9 5,3 5,2 5,7 5,8 6,7 7,0 7,1 7,6 7,9<br />
Gasto por personal 44383,54 44149,16 46344,28 48559,37 48860,11 47414,05 49520,14 53579,87 54216,11 55243,73<br />
% inv / pers 59,19 59,17 61,83 62,07 60,22 63,56 63,68 62,06 61,08 62,37<br />
Producción total 19138 21010 22972 25046 26356 26612 27809 30091 31676 35412<br />
Producción primaria 14493 17609 19219 20602 21851 22215 23369 24852 26155 27960<br />
Productividad (ndoc-inv) 0,40 0,41 0,43 0,42 0,43 0,35 0,35 0,36 0,34 0,35<br />
Productividad (PI-inv) 0,32 0,36 0,38 0,36 0,38 0,31 0,31 0,32 0,30 0,29<br />
Productividad (ndoc-pers) 0,24 0,24 0,26 0,26 0,26 0,22 0,22 0,22 0,21 0,22<br />
Productividad (PI-pers) 0,19 0,22 0,23 0,23 0,23 0,20 0,20 0,20 0,18 0,18<br />
Productividad (ndoc-aut) 0,45 0,45 0,44 0,46 0,45 0,44 0,43 0,43 0,42 0,42<br />
Productividad (PI-aut) 0,35 0,40 0,40 0,40 0,40 0,39 0,38 0,38 0,36 0,35<br />
Nº medio <strong>de</strong> autores por publicación 6,30 6,31 6,14 6,06 6,07 6,54 5,79 5,75 5,87 6,90<br />
Gasto por publicación 185,50 183,37 175,82 188,25 189,53 214,90 223,93 239,06 259,28 252,62<br />
Gasto pon<strong>de</strong>rado por publicación 234,09 204,93 197,72 214,90 215,08 242,01 251,67 272,90 299,48 304,22<br />
Potencial investigador 15165,57 18799,39 20427,67 21940,36 23225,59 23631,35 24743,60 26359,85 27424,26 29405,80<br />
Finp España 1,07 1,09 1,08 1,09 1,08 1,08 1,08 1,08 1,07 1,07<br />
Finp Mundo 1,10 1,11 1,10 1,10 1,10 1,10 1,09 1,08 1,08 1,07<br />
49