Estados de Flujos de Efectivo y Estados Totales de Cambios en el ...
Estados de Flujos de Efectivo y Estados Totales de Cambios en el ...
Estados de Flujos de Efectivo y Estados Totales de Cambios en el ...
- No tags were found...

You also want an ePaper? Increase the reach of your titles
YUMPU automatically turns print PDFs into web optimized ePapers that Google loves.
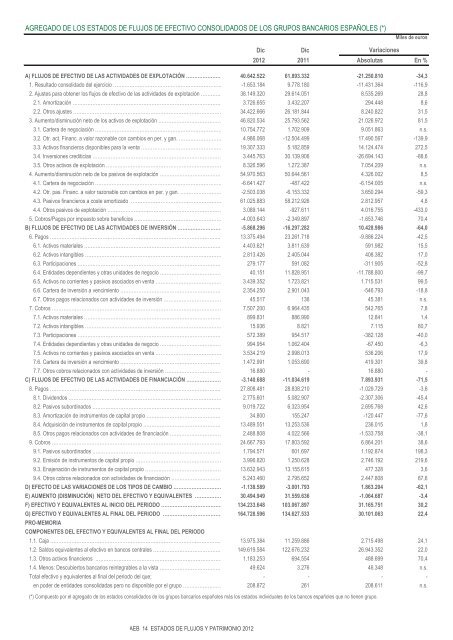
AGREGADO DE LOS ESTADOS DE FLUJOS DE EFECTIVO CONSOLIDADOS DE LOS GRUPOS BANCARIOS ESPAÑOLES (*)Miles <strong>de</strong> eurosDicDic2012 2011 Absolutas En %A) FLUJOS DE EFECTIVO DE LAS ACTIVIDADES DE EXPLOTACIÓN …………………… 40.642.522 61.893.332 -21.250.810 -34,31. Resultado consolidado <strong>de</strong>l ejercicio ………………………………………………………… -1.653.184 9.778.180 -11.431.364 -116,92. Ajustes para obt<strong>en</strong>er los flujos <strong>de</strong> efectivo <strong>de</strong> las activida<strong>de</strong>s <strong>de</strong> explotación …………… 38.149.320 29.614.051 8.535.269 28,82.1. Amortización ………………………………………………………………………………… 3.726.655 3.432.207 294.448 8,62.2. Otros ajustes ……………………………………………………………………………… 34.422.666 26.181.844 8.240.822 31,53. Aum<strong>en</strong>to/disminución neto <strong>de</strong> los activos <strong>de</strong> explotación ………………………………… 46.820.534 25.793.562 21.026.972 81,53.1. Cartera <strong>de</strong> negociación …………………………………………………………………… 10.754.772 1.702.909 9.051.863 n.s.3.2. Otr. act. Financ. a valor razonable con cambios <strong>en</strong> per. y gan. ……………………… 4.986.068 -12.504.499 17.490.567 -139,93.3. Activos financieros disponibles para la v<strong>en</strong>ta …………………………………………… 19.307.333 5.182.859 14.124.474 272,53.4. Inversiones crediticias …………………………………………………………………… 3.445.763 30.139.906 -26.694.143 -88,63.5. Otros activos <strong>de</strong> explotación ……………………………………………………………… 8.326.596 1.272.387 7.054.209 n.s.4. Aum<strong>en</strong>to/disminución neto <strong>de</strong> los pasivos <strong>de</strong> explotación ………………………………… 54.970.563 50.644.561 4.326.002 8,54.1. Cartera <strong>de</strong> negociación …………………………………………………………………… -6.641.427 -487.422 -6.154.005 n.s.4.2. Otr. pas. Financ. a valor razonable con cambios <strong>en</strong> per. y gan. ……………………… -2.503.038 -6.153.332 3.650.294 -59,34.3. Pasivos financieros a coste amortizado ………………………………………………… 61.025.883 58.212.926 2.812.957 4,84.4. Otros pasivos <strong>de</strong> explotación …………………………………………………………… 3.089.144 -927.611 4.016.755 -433,05. Cobros/Pagos por impuesto sobre b<strong>en</strong>eficios ……………………………………………… -4.003.643 -2.349.897 -1.653.746 70,4B) FLUJOS DE EFECTIVO DE LAS ACTIVIDADES DE INVERSIÓN ……………………… -5.868.296 -16.297.282 10.428.986 -64,06. Pagos ………………………………………………………………………………………….. 13.375.494 23.261.718 -9.886.224 -42,56.1. Activos materiales ………………………………………………………………………… 4.403.621 3.811.639 591.982 15,56.2. Activos intangibles ………………………………………………………………………… 2.813.426 2.405.044 408.382 17,06.3. Participaciones ……………………………………………………………………………… 279.177 591.082 -311.905 -52,86.4. Entida<strong>de</strong>s <strong>de</strong>p<strong>en</strong>di<strong>en</strong>tes y otras unida<strong>de</strong>s <strong>de</strong> negocio ………………………………… 40.151 11.828.951 -11.788.800 -99,76.5. Activos no corri<strong>en</strong>tes y pasivos asociados <strong>en</strong> v<strong>en</strong>ta …………………………………… 3.439.352 1.723.821 1.715.531 99,56.6. Cartera <strong>de</strong> inversión a v<strong>en</strong>cimi<strong>en</strong>to ……………………………………………………… 2.354.250 2.901.043 -546.793 -18,86.7. Otros pagos r<strong>el</strong>acionados con activida<strong>de</strong>s <strong>de</strong> inversión ……………………………… 45.517 136 45.381 n.s.7. Cobros …………………………………………………………………………………………. 7.507.200 6.964.435 542.765 7,87.1. Activos materiales ………………………………………………………………………… 899.831 886.990 12.841 1,47.2. Activos intangibles ………………………………………………………………………… 15.936 8.821 7.115 80,77.3. Participaciones ……………………………………………………………………………… 572.389 954.517 -382.128 -40,07.4. Entida<strong>de</strong>s <strong>de</strong>p<strong>en</strong>di<strong>en</strong>tes y otras unida<strong>de</strong>s <strong>de</strong> negocio ………………………………… 994.954 1.062.404 -67.450 -6,37.5. Activos no corri<strong>en</strong>tes y pasivos asociados <strong>en</strong> v<strong>en</strong>ta …………………………………… 3.534.219 2.998.013 536.206 17,97.6. Cartera <strong>de</strong> inversión a v<strong>en</strong>cimi<strong>en</strong>to ……………………………………………………… 1.472.991 1.053.690 419.301 39,87.7. Otros cobros r<strong>el</strong>acionados con activida<strong>de</strong>s <strong>de</strong> inversión ……………………………… 16.880 - 16.880 -C) FLUJOS DE EFECTIVO DE LAS ACTIVIDADES DE FINANCIACIÓN ………………… -3.140.688 -11.034.619 7.893.931 -71,58. Pagos ………………………………………………………………………………………….. 27.808.481 28.838.210 -1.029.729 -3,68.1. Divi<strong>de</strong>ndos ………………………………………………………………………………… 2.775.601 5.082.907 -2.307.306 -45,48.2. Pasivos subordinados ……………………………………………………………………… 9.019.722 6.323.954 2.695.768 42,68.3. Amortización <strong>de</strong> instrum<strong>en</strong>tos <strong>de</strong> capital propio ………………………………………… 34.800 155.247 -120.447 -77,68.4. Adquisición <strong>de</strong> instrum<strong>en</strong>tos <strong>de</strong> capital propio ………………………………………… 13.489.551 13.253.536 236.015 1,88.5. Otros pagos r<strong>el</strong>acionados con activida<strong>de</strong>s <strong>de</strong> financiación …………………………… 2.488.808 4.022.566 -1.533.758 -38,19. Cobros …………………………………………………………………………………………. 24.667.793 17.803.592 6.864.201 38,69.1. Pasivos subordinados ……………………………………………………………………… 1.794.571 601.697 1.192.874 198,39.2. Emisión <strong>de</strong> instrum<strong>en</strong>tos <strong>de</strong> capital propio ……………………………………………… 3.996.820 1.250.628 2.746.192 219,69.3. Enaj<strong>en</strong>ación <strong>de</strong> instrum<strong>en</strong>tos <strong>de</strong> capital propio ………………………………………… 13.632.943 13.155.615 477.328 3,69.4. Otros cobros r<strong>el</strong>acionados con activida<strong>de</strong>s <strong>de</strong> financiación …………………………… 5.243.460 2.795.652 2.447.808 87,6D) EFECTO DE LAS VARIACIONES DE LOS TIPOS DE CAMBIO ………………………… -1.138.589 -3.001.793 1.863.204 -62,1E) AUMENTO (DISMINUCIÓN) NETO DEL EFECTIVO Y EQUIVALENTES ……………… 30.494.949 31.559.636 -1.064.687 -3,4F) EFECTIVO Y EQUIVALENTES AL INICIO DEL PERIODO ………………………………… 134.233.648 103.067.897 31.165.751 30,2G) EFECTIVO Y EQUIVALENTES AL FINAL DEL PERIODO ……………………………… 164.728.596 134.627.533 30.101.063 22,4PRO-MEMORIACOMPONENTES DEL EFECTIVO Y EQUIVALENTES AL FINAL DEL PERIODO1.1. Caja ………………………………………………………………………………………….. 13.975.384 11.259.886 2.715.498 24,11.2. Saldos equival<strong>en</strong>tes al efectivo <strong>en</strong> bancos c<strong>en</strong>trales …………………………………… 149.619.584 122.676.232 26.943.352 22,01.3. Otros activos financieros …………………………………………………………………… 1.183.253 694.554 488.699 70,41.4. M<strong>en</strong>os: Descubiertos bancarios reintegrables a la vista ………………………………… 49.624 3.276 46.348 n.s.Total efectivo y equival<strong>en</strong>tes al final <strong>de</strong>l periodo <strong>de</strong>l que: - - - -<strong>en</strong> po<strong>de</strong>r <strong>de</strong> <strong>en</strong>tida<strong>de</strong>s consolidadas pero no disponible por <strong>el</strong> grupo …………………… 208.872 261 208.611 n.s.(*) Compuesto por <strong>el</strong> agregado <strong>de</strong> los estados consolidados <strong>de</strong> los grupos bancarios españoles más los estados individuales <strong>de</strong> los bancos españoles que no ti<strong>en</strong><strong>en</strong> grupo.VariacionesAEB 14 ESTADOS DE FLUJOS Y PATRIMONIO 2012