2010 Vol. 4 Num. 2 - GCG: Revista de Globalización, Competitividad ...
2010 Vol. 4 Num. 2 - GCG: Revista de Globalización, Competitividad ...
2010 Vol. 4 Num. 2 - GCG: Revista de Globalización, Competitividad ...
- No tags were found...

You also want an ePaper? Increase the reach of your titles
YUMPU automatically turns print PDFs into web optimized ePapers that Google loves.
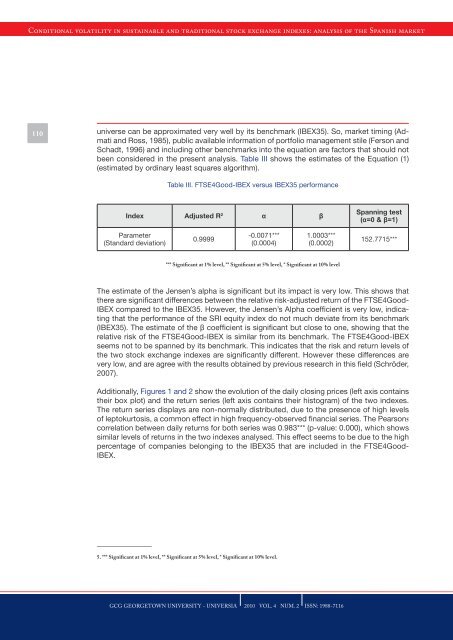
Conditional volatility in sustainable and traditional stock exchange in<strong>de</strong>xes: analysis of the Spanish market110 universe can be approximated very well by its benchmark (IBEX35). So, market timing (Admatiand Ross, 1985), public available information of portfolio management stile (Ferson andSchadt, 1996) and including other benchmarks into the equation are factors that should notbeen consi<strong>de</strong>red in the present analysis. Table III shows the estimates of the Equation (1)(estimated by ordinary least squares algorithm).Table III. FTSE4Good-IBEX versus IBEX35 performanceIn<strong>de</strong>x Adjusted R 2 α βSpanning test(α=0 & β=1)Parameter(Standard <strong>de</strong>viation)0.9999-0.0071***(0.0004)1.0003***(0.0002)152.7715****** Significant at 1% level, ** Significant at 5% level, * Significant at 10% levelThe estimate of the Jensen’s alpha is significant but its impact is very low. This shows thatthere are significant differences between the relative risk-adjusted return of the FTSE4Good-IBEX compared to the IBEX35. However, the Jensen’s Alpha coefficient is very low, indicatingthat the performance of the SRI equity in<strong>de</strong>x do not much <strong>de</strong>viate from its benchmark(IBEX35). The estimate of the β coefficient is significant but close to one, showing that therelative risk of the FTSE4Good-IBEX is similar from its benchmark. The FTSE4Good-IBEXseems not to be spanned by its benchmark. This indicates that the risk and return levels ofthe two stock exchange in<strong>de</strong>xes are significantly different. However these differences arevery low, and are agree with the results obtained by previous research in this field (Schrö<strong>de</strong>r,2007).Additionally, Figures 1 and 2 show the evolution of the daily closing prices (left axis containstheir box plot) and the return series (left axis contains their histogram) of the two in<strong>de</strong>xes.The return series displays are non-normally distributed, due to the presence of high levelsof leptokurtosis, a common effect in high frequency-observed financial series. The Pearson5correlation between daily returns for both series was 0.983*** (p-value: 0.000), which showssimilar levels of returns in the two in<strong>de</strong>xes analysed. This effect seems to be due to the highpercentage of companies belonging to the IBEX35 that are inclu<strong>de</strong>d in the FTSE4Good-IBEX.5. *** Significant at 1% level, ** Significant at 5% level, * Significant at 10% level.<strong>GCG</strong> GEORGETOWN UNIVERSITY - UNIVERSIA <strong>2010</strong> VOL. 4 NUM. 2 ISSN: 1988-7116