2010 Vol. 4 Num. 2 - GCG: Revista de Globalización, Competitividad ...
2010 Vol. 4 Num. 2 - GCG: Revista de Globalización, Competitividad ...
2010 Vol. 4 Num. 2 - GCG: Revista de Globalización, Competitividad ...
- No tags were found...
Create successful ePaper yourself
Turn your PDF publications into a flip-book with our unique Google optimized e-Paper software.
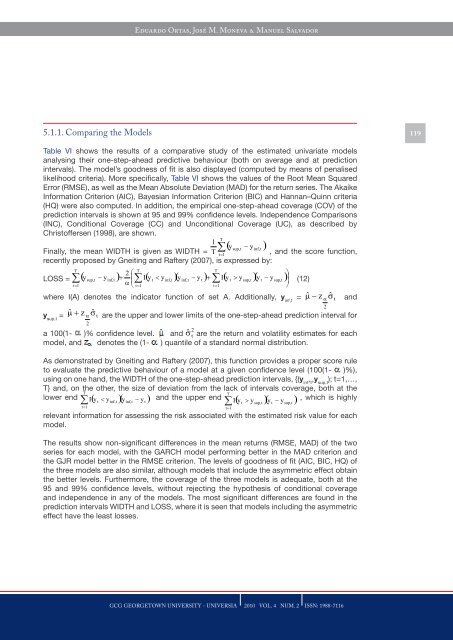
Eduardo Ortas, José M. Moneva & Manuel Salvador5.1.1. Comparing the Mo<strong>de</strong>ls119Table VI shows the results of a comparative study of the estimated univariate mo<strong>de</strong>lsanalysing their one-step-ahead predictive behaviour (both on average and at predictionintervals). The mo<strong>de</strong>l’s goodness of fit is also displayed (computed by means of penalisedlikelihood criteria). More specifically, Table VI shows the values of the Root Mean SquaredError (RMSE), as well as the Mean Absolute Deviation (MAD) for the return series. The AkaikeInformation Criterion (AIC), Bayesian Information Criterion (BIC) and Hannan–Quinn criteria(HQ) were also computed. In addition, the empirical one-step-ahead coverage (COV) of theprediction intervals is shown at 95 and 99% confi<strong>de</strong>nce levels. In<strong>de</strong>pen<strong>de</strong>nce Comparisons(INC), Conditional Coverage (CC) and Unconditional Coverage (UC), as <strong>de</strong>scribed byChristoffersen (1998), are shown.Finally, the mean WIDTH is given as WIDTH =, and the score function,recently proposed by Gneiting and Raftery (2007), is expressed by:LOSS = (12)where I(A) <strong>de</strong>notes the indicator function of set A. Additionally, y inf,t=andy sup,t =are the upper and lower limits of the one-step-ahead prediction interval fora 100(1- )% confi<strong>de</strong>nce level. and are the return and volatility estimates for eachmo<strong>de</strong>l, and <strong>de</strong>notes the (1- ) quantile of a standard normal distribution.As <strong>de</strong>monstrated by Gneiting and Raftery (2007), this function provi<strong>de</strong>s a proper score ruleto evaluate the predictive behaviour of a mo<strong>de</strong>l at a given confi<strong>de</strong>nce level (100(1- )%),using on one hand, the WIDTH of the one-step-ahead prediction intervals, {(y inf, t,y sup,t); t=1,…,T} and, on the other, the size of <strong>de</strong>viation from the lack of intervals coverage, both at thelower end and the upper end , which is highlyrelevant information for assessing the risk associated with the estimated risk value for eachmo<strong>de</strong>l.The results show non-significant differences in the mean returns (RMSE, MAD) of the twoseries for each mo<strong>de</strong>l, with the GARCH mo<strong>de</strong>l performing better in the MAD criterion andthe GJR mo<strong>de</strong>l better in the RMSE criterion. The levels of goodness of fit (AIC, BIC, HQ) ofthe three mo<strong>de</strong>ls are also similar, although mo<strong>de</strong>ls that inclu<strong>de</strong> the asymmetric effect obtainthe better levels. Furthermore, the coverage of the three mo<strong>de</strong>ls is a<strong>de</strong>quate, both at the95 and 99% confi<strong>de</strong>nce levels, without rejecting the hypothesis of conditional coverageand in<strong>de</strong>pen<strong>de</strong>nce in any of the mo<strong>de</strong>ls. The most significant differences are found in theprediction intervals WIDTH and LOSS, where it is seen that mo<strong>de</strong>ls including the asymmetriceffect have the least losses.<strong>GCG</strong> GEORGETOWN UNIVERSITY - UNIVERSIA <strong>2010</strong> VOL. 4 NUM. 2 ISSN: 1988-7116


