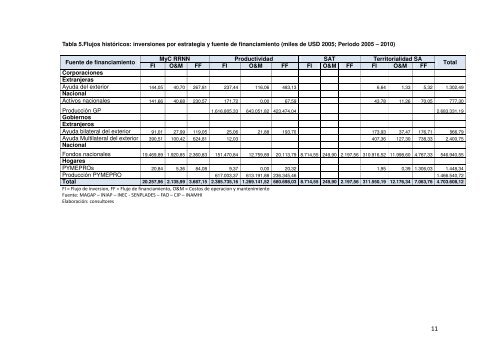
Tabla 5.<strong>Flujos</strong> históricos: inversiones por estrategia y fuente <strong>de</strong> financiamiento (miles <strong>de</strong> USD 2005; Periodo 2005 – 2010)Fuente <strong>de</strong> financiamientoMyC RRNN Productividad SAT Territorialidad SAFI O&M FF FI O&M FF FI O&M FF FI O&M FFTotalCorporacionesExtranjerasAyuda <strong>de</strong>l exterior 144,05 40,70 267,81 237,44 116,06 483,13 6,64 1,33 5,32 1.302,49NacionalActivos nacionales 141,66 40,68 230,57 171,72 0,00 67,59 43,78 11,26 70,05 777,30Producción GP 1.616.805,33 643.051,82 423.474,04 2.683.331,19GobiernosExtranjerosAyuda bilateral <strong>de</strong>l exterior 91,01 27,99 119,05 25,06 21,88 193,70 173,93 37,47 176,71 866,79Ayuda Multilateral <strong>de</strong>l exterior 390,51 100,42 624,81 12,03 407,36 127,30 738,33 2.400,75NacionalFondos nacionales 19.469,89 1.920,85 2.360,83 151.470,84 12.759,89 20.113,79 8.714,55 249,90 2.197,56 310.916,52 11.998,60 4.767,33 546.940,55HogaresPYMEPROs 20,84 5,36 84,08 9,37 0,00 20,32 1,95 0,39 1.306,03 1.448,34Producción PYMEPRO 617.003,37 613.191,88 236.345,46 1.466.540,72Total 20.257,96 2.135,99 3.687,15 2.385.735,16 1.269.141,52 680.698,03 8.714,55 249,90 2.197,56 311.550,19 12.176,34 7.063,76 4.703.608,12FI = Flujo <strong>de</strong> inversion, FF = Flujo <strong>de</strong> financiamiento, O&M = Costos <strong>de</strong> operacion y mantenimientoFuente: MAGAP – INIAP – INEC - SENPLADES – FAO – CIP – INAMHIElaboración: consultores11
Tabla 6.<strong>Flujos</strong> históricos: inversiones por estrategia y año (miles <strong>de</strong> USD 2005)AñosMyC RRNN Productividad SAT Territorialidad SAFI O&M FF FI O&M FF FI O&M FF FI O&M FFTotal2005 878,35 92,71 48,74 413.236,16 233.412,52 121.481,96 1.022,36 41,88 94,00 21.226,38 58,54 4,72 791.598,302006 2.941,80 320,21 325,62 405.817,93 223.696,64 117.198,47 711,47 38,16 650,98 47.591,68 1.497,76 51,54 800.842,252007 726,87 103,67 298,25 446.980,67 234.217,67 122.830,59 1.661,36 44,69 566,77 46.976,10 1.022,09 54,07 855.482,822008 7.752,89 802,58 935,54 376.877,10 193.000,14 108.126,51 3.752,52 70,03 415,15 98.940,34 1.142,72 474,45 792.289,972009 5.069,16 531,42 1.503,07 380.563,71 202.354,61 108.009,12 1.092,74 47,54 366,64 54.671,48 4.890,47 1.406,36 760.506,312010 2.888,88 285,40 575,94 362.259,59 182.459,93 103.051,38 474,10 7,61 104,02 42.144,21 3.564,76 5.072,64 702.888,47Total 20.257,96 2.135,99 3.687,15 2.385.735,16 1.269.141,52 680.698,03 8.714,55 249,90 2.197,56 311.550,19 12.176,34 7.063,76 4.703.608,12FI = Flujo <strong>de</strong> inversion, FF = Flujo <strong>de</strong> financiamiento, O&M = Costos <strong>de</strong> operacion y mantenimientoFuente: MAGAP – INIAP – INEC - SENPLADES – FAO – CIP – INAMHIElaboración: consultores12
- Page 1 and 2: Proyecto:Fortalecimiento de las Cap
- Page 3 and 4: ÍndiceTabla de ContenidoAcrónimos
- Page 5 and 6: Índice de TablasTabla 1: Coeficien
- Page 7 and 8: Índice de GráficosGráfico 1: Map
- Page 9 and 10: Acrónimos y AbreviaturasAIEALAODBC
- Page 11 and 12: SETECISIGAGROSISSANSNAPTIACTMTRBTUL
- Page 13 and 14: 1.1 ObjetivosDesarrollar capacidade
- Page 15 and 16: A nivel nacional el crecimiento del
- Page 17 and 18: • Evaluación del sector transpor
- Page 19 and 20: 2012 126,565 1,370 4,80%2013 126,69
- Page 21 and 22: 2. Alcance Sectorial, Datos Incorpo
- Page 23 and 24: Roseroet al.(2010)Fuente: Varios Au
- Page 25 and 26: Los productos propios de la Costa,
- Page 27 and 28: Públicas para el Agro 2009 - 2013
- Page 29 and 30: Adicionalmente, el país se encuent
- Page 31 and 32: producción promedio asciende a $69
- Page 33: Por otro lado, la síntesis del an
- Page 37 and 38: Asimismo, el MAGAP ha invertido en
- Page 39 and 40: Hidrometeorológicos del Ecuador se
- Page 41 and 42: lograr aprovechamiento productivo,
- Page 43 and 44: El maíz duro amarillo híbrido con
- Page 45 and 46: inversión a realizar. Esto se debe
- Page 47 and 48: Tabla 9.Escenario base total de inv
- Page 49 and 50: sectores de la economía, para lo c
- Page 51 and 52: manera que garanticen la multidimen
- Page 53 and 54: identificación de áreas de alta v
- Page 55 and 56: • Una capacidad real de almacenam
- Page 57 and 58: Tabla 11.Escenario de adaptación t
- Page 59 and 60: En la estrategia de Territorialidad
- Page 61 and 62: Fuente: MAGAP - INIAP -CIPElaboraci
- Page 63 and 64: Tabla 18. Flujos incrementales: est
- Page 65 and 66: El cambio climático afecta a los P
- Page 67 and 68: • Proyecto para el desarrollo, ge
- Page 69 and 70: alimentaria del país. En consecuen
- Page 71 and 72: En materia de comercialización la
- Page 73 and 74: para el consumo. En esta línea el
- Page 75 and 76: persiguen objetivos opuestos y 3) e
- Page 77 and 78: estarían duplicando esfuerzos. Sin
- Page 79 and 80: características de la ciudad como:
- Page 81 and 82: estrategias que permitirán mitigar
- Page 83 and 84: parámetros clave de evaluación, c
- Page 85 and 86:
trans, "al otro lado", y portare, "
- Page 87 and 88:
Productividad. Las inversiones dura
- Page 89 and 90:
En cuanto a la información histór
- Page 91 and 92:
cercano al 80%, lo que incluye el t
- Page 93 and 94:
por provincia. Sobresale la concent
- Page 95 and 96:
Sector Transporte a nivel de provin
- Page 97 and 98:
La Ecovía de Quito que fue constru
- Page 99 and 100:
Gráfico 23. Escenario Línea BaseE
- Page 101 and 102:
Tabla 21.Flujos Constantes, FI, FF
- Page 103 and 104:
3.3.2 Escenario de MitigaciónEl pr
- Page 105 and 106:
Para el escenario de Mitigación, l
- Page 107 and 108:
Categoríade laentidadinversoraHoga
- Page 109 and 110:
3.4. Resultados3.4.1. Cambios incre
- Page 111 and 112:
Las medidas de fomento al transport
- Page 113 and 114:
Tabla 28.Flujos Constantes. FI, FF
- Page 115 and 116:
• La política de transporte y su
- Page 117 and 118:
ministerios e instituciones públic
- Page 119 and 120:
• Elaboración de modelos predict
- Page 121 and 122:
plantaciones y solo un 13% de bosqu
- Page 123 and 124:
• Manejo Sustentable de Bosques.
- Page 125 and 126:
Gráfico 32.Crecimiento de la indus
- Page 127 and 128:
El Gráfico 36 permite visualizar q
- Page 129 and 130:
4.3.2. Escenario de Línea de BaseD
- Page 131 and 132:
Tabla 35. Flujos Proyectados por me
- Page 133 and 134:
Con relación a la proyección para
- Page 135 and 136:
• Manejo Sostenible de Bosques: R
- Page 137 and 138:
políticas nacionales o locales. (i
- Page 139 and 140:
prioritario en el Ecuador. Por ello
- Page 141 and 142:
Tabla 38.Flujos proyectados por med
- Page 143 and 144:
Los flujos totales proyectados por
- Page 145 and 146:
Medida 1: Captura de CO 2 mediante
- Page 147 and 148:
Tabla 42.Incrementos en los flujos
- Page 149 and 150:
Gráfico 44.Valores absolutos de lo
- Page 151 and 152:
Otro punto primordial a analizarse
- Page 153 and 154:
La definición y construcción de e
- Page 155 and 156:
5. Resultados GeneralesEl análisis
- Page 157 and 158:
Gráfico 46. Necesidades relativas
- Page 159 and 160:
6. BibliografíaAbril, J. 2009. Alg
- Page 161 and 162:
FAO (2005) Evaluación de los recur
- Page 163 and 164:
agrícola. Ecuador. Quito.Marchán,
- Page 165 and 166:
Washington, D.C.: U.S. Environmenta
- Page 167 and 168:
al actual. En este sentido hay bien
- Page 169 and 170:
azones(especialmente la existencia
- Page 171 and 172:
mismas, las cuales se vieron consol
- Page 173 and 174:
(5) Incremento de la capacidad de a
- Page 175 and 176:
Estudios y diseños definitivos de
- Page 177 and 178:
Seguridad alimentaria y competitivi
- Page 179 and 180:
Contribuir a alcanzar medios sosten
- Page 181 and 182:
Proyectos y programas del Escenario
- Page 183 and 184:
Desarrollo de alternativas tecnoló
- Page 185 and 186:
Anexo 5: Flujos incrementales por m
- Page 187 and 188:
Sin embargo, deben tenerse en cuent
- Page 189 and 190:
¿Qué hacer?• Implementar silos
- Page 191 and 192:
Anexo 7: Análisis adicional de flu
- Page 193 and 194:
en el Ecuador, la estrategia de Red
- Page 195 and 196:
Anexo 9: Proyecciones macro económ
- Page 197 and 198:
Anexo 10: Flujos anuales corrientes
- Page 199 and 200:
Transporte Terrestre 07 Reducción
- Page 201 and 202:
Transporte Ferroviario 07 Transport
- Page 203 and 204:
Transporte Terrestre 10 Movilidad u
- Page 205 and 206:
Transporte Terrestre 07 Reducción
- Page 207 and 208:
Anexo 12. Flujos anuales constantes
- Page 209 and 210:
Transporte Terrestre 07 Reducción
- Page 211 and 212:
Transporte Ferroviario 07 Transport
- Page 213 and 214:
promedio2. Ingreso por la comercial
- Page 215 and 216:
Flujos de efectivo proyectados para