Untitled - Ministerio de Economía y Finanzas Públicas
Untitled - Ministerio de Economía y Finanzas Públicas
Untitled - Ministerio de Economía y Finanzas Públicas
- No tags were found...
Create successful ePaper yourself
Turn your PDF publications into a flip-book with our unique Google optimized e-Paper software.
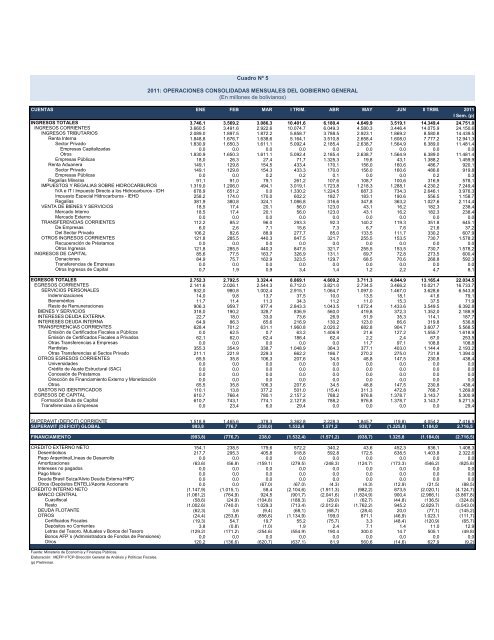
Cuadro Nº 52011: OPERACIONES CONSOLIDADAS MENSUALES DEL GOBIERNO GENERAL(En millones <strong>de</strong> bolivianos)CUENTAS ENE FEB MAR I TRIM. ABR MAY JUN II TRIM. 2011I Sem. (p)INGRESOS TOTALES 3.746,1 3.569,2 3.086,3 10.401,6 6.180,4 4.649,9 3.519,1 14.349,4 24.751,0INGRESOS CORRIENTES 3.660,5 3.491,6 2.922,6 10.074,7 6.049,3 4.580,3 3.446,4 14.075,9 24.150,6INGRESOS TRIBUTARIOS 2.089,0 1.897,5 1.872,2 5.858,7 3.788,5 2.923,1 1.869,2 8.580,8 14.439,5Renta Interna 1.848,8 1.676,7 1.638,6 5.164,1 3.510,8 2.658,4 1.608,0 7.777,2 12.941,3Sector Privado 1.830,9 1.650,3 1.611,1 5.092,4 2.185,4 2.638,7 1.564,9 6.389,0 11.481,4Empresas Capitalizadas 0,0 0,0 0,0 0,0 0,0 0,0 0,0 0,0 0,0Otros 1.830,9 1.650,3 1.611,1 5.092,4 2.185,4 2.638,7 1.564,9 6.389,0 11.481,4Empresas <strong>Públicas</strong> 18,0 26,3 27,4 71,7 1.325,3 19,8 43,1 1.388,2 1.459,9Renta Aduanera 149,1 129,8 154,5 433,4 170,1 156,0 160,6 486,7 920,1Sector Privado 149,1 129,8 154,3 433,3 170,0 156,0 160,6 486,6 919,8Empresas <strong>Públicas</strong> 0,0 0,0 0,2 0,2 0,1 0,0 0,0 0,2 0,3Regalías Mineras 91,1 91,0 79,1 261,2 107,6 108,7 100,6 316,9 578,1IMPUESTOS Y REGALIAS SOBRE HIDROCARBUROS 1.319,0 1.206,0 494,1 3.019,1 1.723,8 1.218,3 1.288,1 4.230,2 7.249,4IVA e IT / Impuesto Directo a los Hidrocarburos - IDH 678,9 651,2 0,0 1.330,2 1.224,5 687,3 734,3 2.646,1 3.976,3Impuesto Especial Hidrocarburos - IEHD 258,2 174,0 170,0 602,2 182,7 183,1 190,6 556,5 1.158,7Regalías 381,9 380,8 324,1 1.086,8 316,6 347,8 363,2 1.027,6 2.114,4VENTA DE BIENES Y SERVICIOS 18,5 17,4 20,1 56,0 123,0 43,1 16,2 182,3 238,4Mercado Interno 18,5 17,4 20,1 56,0 123,0 43,1 16,2 182,3 238,4Mercado Externo 0,0 0,0 0,0 0,0 0,0 0,0 0,0 0,0 0,0TRANSFERENCIAS CORRIENTES 112,2 85,2 96,0 293,3 92,3 140,2 119,3 351,8 645,1De Empresas 6,0 2,6 7,1 15,6 7,3 6,7 7,6 21,6 37,2Del Sector Privado 106,2 82,6 88,9 277,7 85,0 133,5 111,7 330,2 607,9OTROS INGRESOS CORRIENTES 121,8 285,5 440,3 847,5 321,7 255,5 153,5 730,7 1.578,2Recuperación <strong>de</strong> Préstamos 0,0 0,0 0,0 0,0 0,0 0,0 0,0 0,0 0,0Otros Ingresos 121,8 285,5 440,3 847,5 321,7 255,5 153,5 730,7 1.578,2INGRESOS DE CAPITAL 85,6 77,5 163,7 326,9 131,1 69,7 72,8 273,5 600,4Donaciones 84,9 75,7 162,9 323,5 129,7 68,5 70,6 268,8 592,3Transferencias <strong>de</strong> Empresas 0,0 0,0 0,0 0,0 0,0 0,0 0,0 0,0 0,0Otros Ingresos <strong>de</strong> Capital 0,7 1,9 0,9 3,4 1,4 1,2 2,2 4,7 8,1EGRESOS TOTALES 2.752,3 2.792,5 3.324,4 8.869,1 4.609,2 3.711,3 4.844,9 13.165,4 22.034,5EGRESOS CORRIENTES 2.141,6 2.026,1 2.544,3 6.712,0 3.821,0 2.734,5 3.466,2 10.021,7 16.733,7SERVICIOS PERSONALES 932,0 980,8 1.002,4 2.915,1 1.064,7 1.097,0 1.467,0 3.628,6 6.543,8In<strong>de</strong>mnizaciones 14,0 9,8 13,7 37,5 10,0 13,5 18,1 41,6 79,1Beneméritos 11,7 11,4 11,3 34,3 11,2 11,0 15,3 37,5 71,9Resto <strong>de</strong> Remuneraciones 906,3 959,7 977,4 2.843,3 1.043,5 1.072,4 1.433,6 3.549,5 6.392,8BIENES Y SERVICIOS 318,0 190,2 328,7 836,9 560,0 419,8 372,3 1.352,0 2.188,9INTERESES DEUDA EXTERNA 22,7 18,0 33,0 73,6 26,9 51,9 35,3 114,1 187,7INTERESES DEUDA INTERNA 64,9 86,3 65,6 216,9 130,2 123,0 66,6 319,8 536,8TRANSFERENCIAS CORRIENTES 628,4 701,2 631,1 1.960,8 2.020,2 682,8 904,7 3.607,7 5.568,5Emisión <strong>de</strong> Certificados Fiscales a Públicos 0,0 62,5 0,7 63,2 1.406,9 21,6 127,2 1.555,7 1.618,9Emisión <strong>de</strong> Certificados Fiscales a Privados 62,1 62,0 62,4 186,4 62,4 2,2 2,4 67,0 253,5Otras Transferencias a Empresas 0,0 0,0 0,0 0,0 0,0 11,7 97,1 108,8 108,8Rentistas 355,3 354,9 338,7 1.048,9 364,3 377,1 403,0 1.144,4 2.193,2Otras Transferencias al Sectos Privado 211,1 221,9 229,3 662,2 186,7 270,2 275,0 731,8 1.394,0OTROS EGRESOS CORRIENTES 65,5 35,8 106,3 207,6 34,5 48,8 147,5 230,8 438,4Universida<strong>de</strong>s 0,0 0,0 0,0 0,0 0,0 0,0 0,0 0,0 0,0Crédito <strong>de</strong> Ajuste Estructural (SAC) 0,0 0,0 0,0 0,0 0,0 0,0 0,0 0,0 0,0Concesión <strong>de</strong> Préstamos 0,0 0,0 0,0 0,0 0,0 0,0 0,0 0,0 0,0Dirección <strong>de</strong> Financiamiento Externo y Monetización 0,0 0,0 0,0 0,0 0,0 0,0 0,0 0,0 0,0Otros 65,5 35,8 106,3 207,6 34,5 48,8 147,5 230,8 438,4GASTOS NO IDENTIFICADOS 110,1 13,8 377,2 501,0 (15,4) 311,3 472,8 768,7 1.269,8EGRESOS DE CAPITAL 610,7 766,4 780,1 2.157,2 788,2 976,8 1.378,7 3.143,7 5.300,9Formación Bruta <strong>de</strong> Capital 610,7 743,1 774,1 2.127,8 788,2 976,8 1.378,7 3.143,7 5.271,5Transferencias a Empresas 0,0 23,4 6,0 29,4 0,0 0,0 0,0 0,0 29,4SUPERAVIT (DEFICIT) CORRIENTE 1.518,9 1.465,6 378,3 3.362,8 2.228,3 1.845,7 (19,8) 4.054,2 7.416,9SUPERAVIT (DEFICIT) GLOBAL 993,8 776,7 (238,0) 1.532,4 1.571,2 938,7 (1.325,8) 1.184,0 2.716,5FINANCIAMIENTO (993,8) (776,7) 238,0 (1.532,4) (1.571,2) (938,7) 1.325,8 (1.184,0) (2.716,5)CREDITO EXTERNO NETO 154,1 238,5 179,6 572,2 340,2 43,6 452,3 836,1 1.408,3Desembolsos 217,7 295,3 405,8 918,8 592,8 172,5 638,5 1.403,8 2.322,6Pago Argentina/Líneas <strong>de</strong> Desarrollo 0,0 0,0 0,0 0,0 0,0 0,0 0,0 0,0 0,0Amortizaciones (63,6) (56,8) (159,1) (279,5) (248,3) (124,7) (173,3) (546,2) (825,8)Intereses no pagados 0,0 0,0 0,0 0,0 0,0 0,0 0,0 0,0 0,0Pago Mora 0,0 0,0 0,0 0,0 0,0 0,0 0,0 0,0 0,0Deuda Brasil Suiza/Alivio Deuda Externa HIPC 0,0 0,0 0,0 0,0 0,0 0,0 0,0 0,0 0,0Otros (Depósitos ENTEL)/Aporte Accionario 0,0 0,0 (67,0) (67,0) (4,3) (4,3) (12,9) (21,5) (88,5)CREDITO INTERNO NETO (1.147,9) (1.015,1) 58,4 (2.104,6) (1.911,3) (982,2) 873,5 (2.020,1) (4.124,7)BANCO CENTRAL (1.061,2) (764,9) 924,5 (901,7) (2.041,6) (1.824,9) 900,4 (2.966,1) (3.867,8)Cuasifiscal (58,6) (24,9) (104,8) (188,3) (29,0) (62,7) (44,8) (136,5) (324,8)Resto (1.002,6) (740,0) 1.029,3 (713,4) (2.012,6) (1.762,2) 945,2 (2.829,7) (3.543,0)DEUDA FLOTANTE (62,3) 3,6 (9,4) (68,1) (68,7) (28,4) 20,0 (77,1) (145,2)OTROS (24,4) (253,8) (856,6) (1.134,9) 199,0 871,1 (46,9) 1.023,1 (111,7)Certificados Fiscales (19,3) 54,7 19,7 55,2 (75,7) 3,3 (48,4) (120,9) (65,7)Depósitos no Corrientes 3,8 (0,8) (1,0) 1,9 2,4 7,1 1,4 11,0 12,9Letras <strong>de</strong>l Tesoro, Mutuales y Bonos <strong>de</strong>l Tesoro (129,2) (171,2) (254,6) (554,9) 190,4 300,0 14,7 505,1 (49,8)Bonos AFP´s (Administradora <strong>de</strong> Fondos <strong>de</strong> Pensiones) 0,0 0,0 0,0 0,0 0,0 0,0 0,0 0,0 0,0Otros 120,2 (136,6) (620,7) (637,1) 81,9 560,6 (14,6) 627,9 (9,2)Fuente: <strong>Ministerio</strong> <strong>de</strong> <strong>Economía</strong> y <strong>Finanzas</strong> <strong>Públicas</strong>.Elaboración: MEFP-VTCP-Dirección General <strong>de</strong> Análisis y Políticas Fiscales.(p) Preliminar.


