Untitled - Ministerio de Economía y Finanzas Públicas
Untitled - Ministerio de Economía y Finanzas Públicas
Untitled - Ministerio de Economía y Finanzas Públicas
- No tags were found...

Create successful ePaper yourself
Turn your PDF publications into a flip-book with our unique Google optimized e-Paper software.
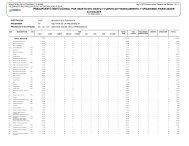
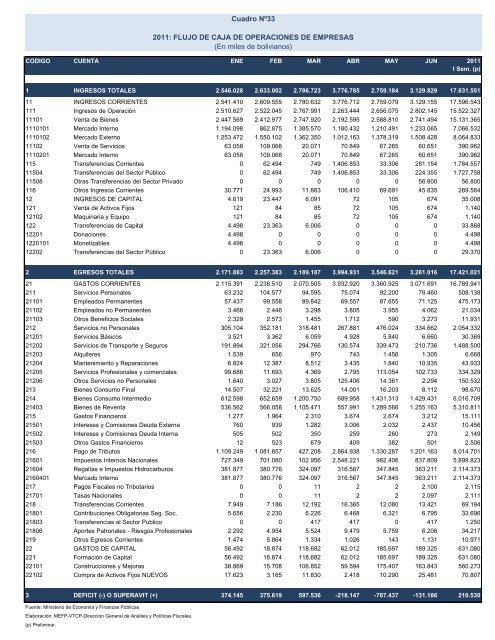
Cuadro Nº332011: FLUJO DE CAJA DE OPERACIONES DE EMPRESAS(En miles <strong>de</strong> bolivianos)CODIGO CUENTA ENE FEB MAR ABR MAY JUN 2011I Sem. (p)1 INGRESOS TOTALES 2.546.028 2.633.002 2.786.723 3.776.785 2.759.184 3.129.829 17.631.55111 INGRESOS CORRIENTES 2.541.410 2.609.555 2.780.632 3.776.712 2.759.079 3.129.155 17.596.543111 Ingresos <strong>de</strong> Operación 2.510.627 2.522.045 2.767.991 2.263.444 2.656.075 2.802.145 15.522.32711101 Venta <strong>de</strong> Bienes 2.447.569 2.412.977 2.747.920 2.192.595 2.588.810 2.741.494 15.131.3651110101 Mercado Interno 1.194.098 862.875 1.385.570 1.180.432 1.210.491 1.233.065 7.066.5321110102 Mercado Externo 1.253.472 1.550.102 1.362.350 1.012.163 1.378.319 1.508.428 8.064.83311102 Venta <strong>de</strong> Servicios 63.058 109.068 20.071 70.849 67.265 60.651 390.9621110201 Mercado Interno 63.058 109.068 20.071 70.849 67.265 60.651 390.962115 Transferencias Corrientes 0 62.494 749 1.406.853 33.306 281.154 1.784.55711504 Transferencias <strong>de</strong>l Sector Público 0 62.494 749 1.406.853 33.306 224.355 1.727.75811508 Otras Transferencias <strong>de</strong>l Sector Privado 0 0 0 0 0 56.800 56.800116 Otros Ingresos Corrientes 30.771 24.993 11.883 106.410 69.691 45.835 289.58412 INGRESOS DE CAPITAL 4.619 23.447 6.091 72 105 674 35.008121 Venta <strong>de</strong> Activos Fijos 121 84 85 72 105 674 1.14012102 Maquinaria y Equipo 121 84 85 72 105 674 1.140122 Transferencias <strong>de</strong> Capital 4.498 23.363 6.006 0 0 0 33.86812201 Donaciones 4.498 0 0 0 0 0 4.4981220101 Monetizables 4.498 0 0 0 0 0 4.49812202 Transferencias <strong>de</strong>l Sector Público 0 23.363 6.006 0 0 0 29.3702 EGRESOS TOTALES 2.171.883 2.257.383 2.189.187 3.994.931 3.546.621 3.261.016 17.421.02121 GASTOS CORRIENTES 2.115.391 2.238.510 2.070.505 3.932.920 3.360.925 3.071.691 16.789.941211 Servicios Personales 63.232 104.577 94.595 75.074 92.200 78.460 508.13821101 Empleados Permanentes 57.437 99.558 89.842 69.557 87.655 71.125 475.17321102 Empleados no Permanentes 3.466 2.446 3.298 3.805 3.955 4.062 21.03421103 Otros Beneficios Sociales 2.329 2.573 1.455 1.712 590 3.273 11.931212 Servicios no Personales 305.104 352.181 318.481 267.881 476.024 334.662 2.054.33221201 Servicios Básicos 3.521 3.362 6.059 4.928 5.840 6.660 30.36921202 Servicios <strong>de</strong> Transporte y Seguros 191.894 321.056 294.766 130.574 339.473 210.736 1.488.50021203 Alquileres 1.539 656 970 743 1.456 1.305 6.66821204 Mantenimiento y Reparaciones 6.824 12.387 8.512 3.435 1.840 10.935 43.93321205 Servicios Profesionales y comerciales 99.686 11.693 4.369 2.795 113.054 102.733 334.32921206 Otros Servicios no Personales 1.640 3.027 3.805 125.406 14.361 2.294 150.532213 Bienes Consumo Final 14.507 32.221 13.625 14.001 16.203 8.112 98.670214 Bienes Consumo Intermedio 612.598 652.659 1.200.750 689.958 1.431.313 1.429.431 6.016.70921403 Bienes <strong>de</strong> Reventa 536.562 566.058 1.105.471 557.991 1.289.566 1.255.163 5.310.811215 Gastos Financieros 1.277 1.964 2.310 3.674 2.674 3.212 15.11121501 Intereses y Comisiones Deuda Externa 760 939 1.282 3.006 2.032 2.437 10.45621502 Intereses y Comisiones Deuda Interna 505 502 350 259 260 273 2.14921503 Otros Gastos Financieros 12 523 679 409 382 501 2.506216 Pago <strong>de</strong> Tributos 1.109.249 1.081.857 427.208 2.864.938 1.330.287 1.201.163 8.014.70121601 Impuestos Internos Nacionales 727.349 701.080 102.956 2.548.221 982.406 837.809 5.899.82321604 Regalías e Impuestos Hidrocarburos 381.877 380.776 324.097 316.567 347.845 363.211 2.114.3732160401 Mercado Interno 381.877 380.776 324.097 316.567 347.845 363.211 2.114.373217 Pagos Fiscales no Tributarios 0 0 11 2 2 2.100 2.11521701 Tasas Nacionales 0 0 11 2 2 2.097 2.111218 Transferencias Corrientes 7.949 7.186 12.192 16.365 12.080 13.421 69.19421801 Contribuciones Obligatorias Seg. Soc. 5.656 2.230 6.226 6.468 6.321 6.795 33.69621803 Transferencias al Sector Publico 0 0 417 417 0 417 1.25021806 Aportes Patronales - Riesgos Profesionales 2.292 4.954 5.524 9.479 5.759 6.208 34.217219 Otros Egresos Corrientes 1.474 5.864 1.334 1.026 143 1.131 10.97122 GASTOS DE CAPITAL 56.492 18.874 118.682 62.012 185.697 189.325 631.080221 Formación <strong>de</strong> Capital 56.492 18.874 118.682 62.012 185.697 189.325 631.08022101 Construcciones y Mejoras 38.869 15.708 106.852 59.594 175.407 163.843 560.27322102 Compra <strong>de</strong> Activos Fijos NUEVOS 17.623 3.165 11.830 2.418 10.290 25.481 70.8073 DEFICIT (-) O SUPERAVIT (+) 374.145 375.619 597.536 -218.147 -787.437 -131.186 210.530Fuente: <strong>Ministerio</strong> <strong>de</strong> <strong>Economía</strong> y <strong>Finanzas</strong> <strong>Públicas</strong>.Elaboración: MEFP-VTCP-Dirección General <strong>de</strong> Análisis y Políticas Fiscales.(p) Preliminar.