Untitled - Ministerio de Economía y Finanzas Públicas
Untitled - Ministerio de Economía y Finanzas Públicas
Untitled - Ministerio de Economía y Finanzas Públicas
- No tags were found...

Create successful ePaper yourself
Turn your PDF publications into a flip-book with our unique Google optimized e-Paper software.
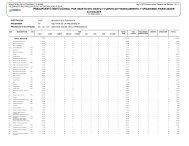
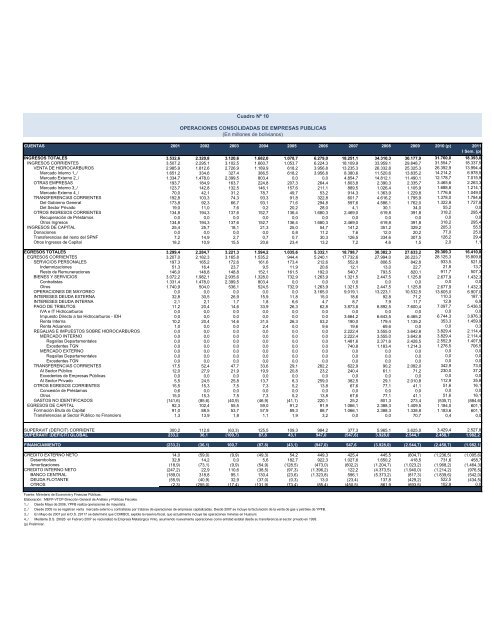
Cuadro Nº 10OPERACIONES CONSOLIDADAS DE EMPRESAS PUBLICAS(En millones <strong>de</strong> bolivianos)CUENTAS 2001 2002 2003 2004 2005 2006 2007 2008 2009 2010 (p) 2011I Sem. (p)INGRESOS TOTALES 3.532,6 2.320,8 3.120,6 1.682,0 1.078,7 6.279,0 18.251,1 34.310,3 30.177,9 31.760,0 18.393,0INGRESOS CORRIENTES 3.507,2 2.295,1 3.102,5 1.660,7 1.053,7 6.224,3 18.109,9 33.959,1 29.848,7 31.554,7 18.337,5VENTA DE HIDROCARBUROS 2.985,9 1.812,6 2.726,9 1.189,9 618,2 3.956,8 13.235,3 26.332,8 25.325,3 26.392,9 13.994,4Mercado Interno 1_/ 1.651,2 334,6 327,4 386,5 618,2 3.956,8 8.380,6 11.520,6 13.835,2 14.214,2 6.978,5Mercado Externo 2_/ 1.334,7 1.478,0 2.399,5 803,4 0,0 0,0 4.854,7 14.812,1 11.490,1 12.178,7 7.015,9OTRAS EMPRESAS 193,7 184,9 163,7 224,8 207,3 264,4 1.803,8 2.390,3 2.335,7 3.465,6 2.263,3Mercado Interno 3_/ 123,7 142,8 132,5 146,1 157,6 211,1 889,5 1.026,4 1.105,9 1.688,8 1.214,1Mercado Externo 4_/ 70,0 42,1 31,2 78,7 49,7 53,2 914,3 1.363,9 1.229,8 1.776,8 1.049,0TRANSFERENCIAS CORRIENTES 192,8 103,3 74,3 93,3 91,8 322,8 601,7 4.616,2 1.795,9 1.378,0 1.784,6Del Gobierno General 173,8 92,3 66,7 93,1 71,6 294,8 597,6 4.586,1 1.762,0 1.322,8 1.727,8Del Sector Privado 19,0 11,0 7,6 0,2 20,2 28,0 4,1 30,1 34,0 55,2 0,0OTROS INGRESOS CORRIENTES 134,8 194,3 137,6 152,7 136,4 1.680,3 2.469,0 619,8 391,8 318,2 295,4Recuperación <strong>de</strong> Préstamos 0,0 0,0 0,0 0,0 0,0 0,0 0,0 0,0 0,0 0,0 0,0Otros Ingresos 134,8 194,3 137,6 152,7 136,4 1.680,3 2.469,0 619,8 391,8 318,2 295,4INGRESOS DE CAPITAL 25,4 25,7 18,1 21,3 25,0 54,7 141,2 351,2 329,2 205,3 55,5Donaciones 0,0 0,0 0,0 0,0 0,8 11,2 7,6 12,0 20,2 77,0 25,0Transferencias <strong>de</strong>l resto <strong>de</strong>l SPNF 7,2 14,9 2,7 0,7 0,7 30,3 126,5 334,6 307,5 126,2 29,4Otros Ingresos <strong>de</strong> Capital 18,2 10,9 15,5 20,6 23,4 13,2 7,2 4,6 1,5 2,0 1,1EGRESOS TOTALES 3.299,4 2.284,7 3.221,3 1.594,2 1.035,6 5.332,1 18.798,7 30.382,3 27.633,2 29.309,3 16.410,8EGRESOS CORRIENTES 3.207,0 2.182,3 3.165,8 1.535,2 944,4 5.240,1 17.732,6 27.994,0 26.223,7 28.125,3 15.809,8SERVICIOS PERSONALES 197,3 165,2 172,6 161,6 173,4 212,6 552,8 806,5 842,8 933,5 521,0In<strong>de</strong>mnizaciones 51,3 16,4 23,7 9,5 11,9 20,6 12,1 13,0 22,7 21,8 13,7Resto <strong>de</strong> Remuneraciones 146,0 148,8 148,8 152,1 161,5 192,0 540,7 793,5 820,1 911,7 507,3BIENES Y SERVICIOS 3.072,2 1.982,1 2.935,6 1.328,0 732,9 1.263,9 1.321,5 2.447,5 1.125,8 2.677,9 1.432,3Contratistas 1.331,4 1.478,0 2.399,5 803,4 0,0 0,0 0,0 0,0 0,0 0,0 0,0Otros 1.740,9 504,0 536,1 524,5 732,9 1.263,9 1.321,5 2.447,5 1.125,8 2.677,9 1.432,3OPERACIONES DE MAYOREO 0,0 0,0 0,0 0,0 0,0 3.165,0 9.019,1 13.223,1 10.532,5 13.605,0 6.907,0INTERESES DEUDA EXTERNA 32,8 30,5 26,9 15,9 11,8 15,0 18,6 92,8 71,2 110,3 187,1INTERESES DEUDA INTERNA 2,1 2,1 1,7 1,8 6,6 4,7 8,7 7,9 11,7 12,8 6,9PAGO DE TRIBUTOS 11,2 20,4 14,6 33,9 26,3 62,8 3.873,8 6.892,5 7.600,4 7.097,7 5.436,5IVA e IT Hidrocarburos 0,0 0,0 0,0 0,0 0,0 0,0 0,0 0,0 0,0 0,0 0,0Impuesto Directo a los Hidrocarburos - IDH 0,0 0,0 0,0 0,0 0,0 0,0 3.664,2 6.643,5 6.465,2 6.744,3 3.976,3Renta Interna 10,2 20,4 14,6 31,5 26,3 53,2 190,0 179,4 1.135,2 353,3 1.459,9Renta Aduanera 1,0 0,0 0,0 2,4 0,0 9,6 19,6 69,6 0,0 0,0 0,3REGALIAS E IMPUESTOS SOBRE HIDROCARBUROS 0,0 0,0 0,0 0,0 0,0 0,0 2.222,4 3.555,0 3.642,8 3.829,4 2.114,4MERCADO INTERNO 0,0 0,0 0,0 0,0 0,0 0,0 2.222,4 3.555,0 3.642,8 3.829,4 2.114,4Regalías Departamentales 0,0 0,0 0,0 0,0 0,0 0,0 1.481,6 2.371,6 2.428,5 2.552,9 1.407,9Exce<strong>de</strong>ntes TGN 0,0 0,0 0,0 0,0 0,0 0,0 740,8 1.183,4 1.214,3 1.276,5 706,5MERCADO EXTERNO 0,0 0,0 0,0 0,0 0,0 0,0 0,0 0,0 0,0 0,0 0,0Regalías Departamentales 0,0 0,0 0,0 0,0 0,0 0,0 0,0 0,0 0,0 0,0 0,0Exce<strong>de</strong>ntes TGN 0,0 0,0 0,0 0,0 0,0 0,0 0,0 0,0 0,0 0,0 0,0TRANSFERENCIAS CORRIENTES 17,5 52,4 47,7 33,6 29,1 282,2 622,9 90,2 2.082,0 342,9 73,0Al Sector Público 12,0 27,9 21,9 19,9 20,8 23,2 240,4 61,1 71,2 230,0 37,2Exce<strong>de</strong>ntes <strong>de</strong> Empresas <strong>Públicas</strong> 0,0 0,0 0,0 0,0 0,0 0,0 0,0 0,0 0,0 0,0 0,0Al Sector Privado 5,5 24,5 25,8 13,7 8,3 259,0 382,5 29,1 2.010,8 112,9 35,8OTROS EGRESOS CORRIENTES 15,5 15,3 7,5 7,3 5,2 13,8 67,6 77,1 41,1 51,6 16,1Concesión <strong>de</strong> Préstamos 0,6 0,0 0,0 0,0 0,0 0,0 0,0 0,0 0,0 0,0 0,0Otros 15,0 15,3 7,5 7,3 5,2 13,8 67,6 77,1 41,1 51,6 16,1GASTOS NO IDENTIFICADOS (141,6) (85,6) (40,9) (46,9) (41,1) 220,1 25,2 801,3 273,4 (535,7) (884,6)EGRESOS DE CAPITAL 92,3 102,4 55,5 59,0 91,2 91,9 1.066,1 2.388,3 1.409,5 1.184,0 601,1Formación Bruta <strong>de</strong> Capital 91,0 88,5 53,7 57,9 89,3 88,7 1.066,1 2.388,3 1.338,8 1.183,6 601,1Transferencias al Sector Público no Financiero 1,3 13,9 1,8 1,1 1,9 3,2 0,0 0,0 70,7 0,4 0,0SUPERAVIT (DEFICIT) CORRIENTE 300,2 112,8 (63,3) 125,5 109,3 984,2 377,3 5.965,1 3.625,0 3.429,4 2.527,8SUPERAVIT (DEFICIT) GLOBAL 233,2 36,1 (100,7) 87,8 43,1 947,0 (547,6) 3.928,0 2.544,7 2.450,7 1.982,2FINANCIAMIENTO (233,2) (36,1) 100,7 (87,8) (43,1) (947,0) 547,6 (3.928,0) (2.544,7) (2.450,7) (1.982,1)CREDITO EXTERNO NETO 14,0 (59,0) (9,9) (49,3) 54,2 449,3 425,4 445,5 (604,7) (1.236,5) (1.005,6)Desembolsos 32,8 14,2 0,0 5,6 182,7 922,3 1.027,6 1.650,2 418,5 731,6 458,7Amortizaciones (18,9) (73,1) (9,9) (54,9) (128,5) (473,0) (602,2) (1.204,7) (1.023,2) (1.968,2) (1.464,3)CREDITO INTERNO NETO (247,2) 22,9 110,6 (38,5) (97,3) (1.396,2) 122,2 (4.373,5) (1.940,0) (1.214,2) (976,5)BANCO CENTRAL (189,0) 318,8 95,1 130,4 (23,6) (1.323,8) 596,1 (5.373,2) (817,3) (1.839,6) (542,0)DEUDA FLOTANTE (55,9) (40,9) 32,9 (37,0) (0,3) 13,0 (23,4) 137,8 (429,2) 522,5 (434,5)OTROS (2,3) (255,0) (17,4) (131,9) (73,4) (85,4) (450,5) 861,9 (693,5) 102,9 0,0Fuente: <strong>Ministerio</strong> <strong>de</strong> <strong>Economía</strong> y <strong>Finanzas</strong> <strong>Públicas</strong>.Elaboración: MEFP-VTCP-Dirección General <strong>de</strong> Análisis y Políticas Fiscales.1_/ Des<strong>de</strong> Mayo <strong>de</strong> 2006, YPFB realiza operaciones <strong>de</strong> mayorista.2_/ Des<strong>de</strong> 2005 no se registran venta mercado externo y contratistas por tratarse <strong>de</strong> operaciones <strong>de</strong> empresas capitalizadas. Des<strong>de</strong> 2007 se incluye la facturación <strong>de</strong> la venta <strong>de</strong> gas y petróleo <strong>de</strong> YPFB.3_/ En Mayo <strong>de</strong> 2007 por el D.S. 29117 se <strong>de</strong>terminó que COMIBOL explote la reserva fiscal, que actualmente incluye las operaciones mineras en Huanuni.4_/ Mediante D.S. 29026 en Febrero 2007 se nacionalizó la Empresa Metalúrgica Vinto, asumiendo nuevamente operaciones como entidad estatal <strong>de</strong>s<strong>de</strong> su transferencia al sector privado en 1999.(p) Preliminar.