Untitled - Ministerio de Economía y Finanzas Públicas
Untitled - Ministerio de Economía y Finanzas Públicas
Untitled - Ministerio de Economía y Finanzas Públicas
- No tags were found...

Create successful ePaper yourself
Turn your PDF publications into a flip-book with our unique Google optimized e-Paper software.
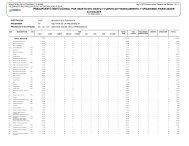
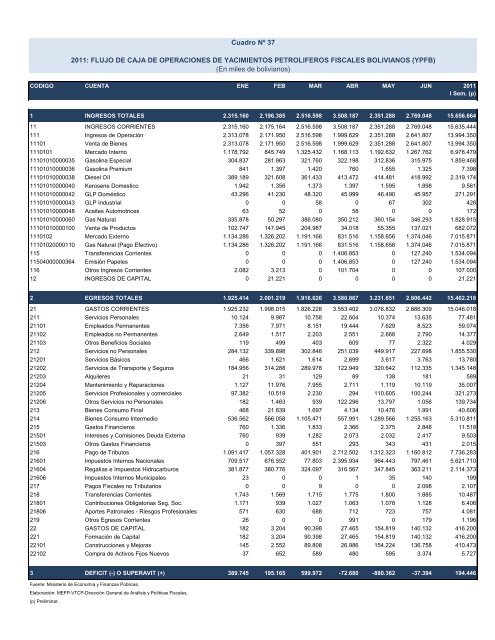
Cuadro Nº 372011: FLUJO DE CAJA DE OPERACIONES DE YACIMIENTOS PETROLIFEROS FISCALES BOLIVIANOS (YPFB)(En miles <strong>de</strong> bolivianos)CODIGO CUENTA ENE FEB MAR ABR MAY JUN 2011I Sem. (p)1 INGRESOS TOTALES 2.315.160 2.196.385 2.516.598 3.508.187 2.351.288 2.769.048 15.656.66411 INGRESOS CORRIENTES 2.315.160 2.175.164 2.516.598 3.508.187 2.351.288 2.769.048 15.635.444111 Ingresos <strong>de</strong> Operación 2.313.078 2.171.950 2.516.598 1.999.629 2.351.288 2.641.807 13.994.35011101 Venta <strong>de</strong> Bienes 2.313.078 2.171.950 2.516.598 1.999.629 2.351.288 2.641.807 13.994.3501110101 Mercado Interno 1.178.792 845.749 1.325.432 1.168.113 1.192.632 1.267.762 6.978.47911101010000035 Gasolina Especial 304.837 281.863 321.760 322.198 312.836 315.975 1.859.46811101010000036 Gasolina Premium 841 1.397 1.420 760 1.655 1.325 7.39811101010000038 Diesel Oíl 389.189 321.608 361.433 413.472 414.481 418.992 2.319.17411101010000040 Kerosene Domestico 1.942 1.356 1.373 1.397 1.595 1.898 9.56111101010000042 GLP Doméstico 43.296 41.230 48.320 45.999 46.490 45.957 271.29111101010000043 GLP Industrial 0 0 58 0 67 302 42811101010000048 Aceites Automotrices 63 52 0 58 0 0 17211101010000060 Gas Natural 335.878 50.297 386.080 350.212 360.154 346.293 1.828.91511101010000100 Venta <strong>de</strong> Productos 102.747 147.945 204.987 34.018 55.355 137.021 682.0721110102 Mercado Externo 1.134.286 1.326.202 1.191.166 831.516 1.158.656 1.374.046 7.015.87111101020000110 Gas Natural (Pago Efectivo) 1.134.286 1.326.202 1.191.166 831.516 1.158.656 1.374.046 7.015.871115 Transferencias Corrientes 0 0 0 1.406.853 0 127.240 1.534.09411504000000364 Emisión Papeles 0 0 0 1.406.853 0 127.240 1.534.094116 Otros Ingresos Corrientes 2.082 3.213 0 101.704 0 0 107.00012 INGRESOS DE CAPITAL 0 21.221 0 0 0 0 21.2212 EGRESOS TOTALES 1.925.414 2.001.219 1.916.626 3.580.867 3.231.651 2.806.442 15.462.21821 GASTOS CORRIENTES 1.925.232 1.998.015 1.826.228 3.553.402 3.076.832 2.666.309 15.046.018211 Servicios Personales 10.124 9.987 10.758 22.604 10.374 13.635 77.48121101 Empleados Permanentes 7.356 7.971 8.151 19.444 7.629 8.523 59.07421102 Empleados no Permanentes 2.649 1.517 2.203 2.551 2.668 2.790 14.37721103 Otros Beneficios Sociales 119 499 403 609 77 2.322 4.029212 Servicios no Personales 284.132 339.898 302.846 251.039 449.917 227.698 1.855.53021201 Servicios Básicos 466 1.621 1.614 2.699 3.617 3.763 13.78021202 Servicios <strong>de</strong> Transporte y Seguros 184.956 314.288 289.978 122.949 320.642 112.335 1.345.14821203 Alquileres 21 31 129 89 138 181 58921204 Mantenimiento y Reparaciones 1.127 11.976 7.955 2.711 1.119 10.119 35.00721205 Servicios Profesionales y comerciales 97.382 10.519 2.230 294 110.605 100.244 321.27321206 Otros Servicios no Personales 182 1.463 939 122.296 13.797 1.056 139.734213 Bienes Consumo Final 468 21.839 1.697 4.134 10.476 1.991 40.606214 Bienes Consumo Intermedio 536.562 566.058 1.105.471 557.991 1.289.566 1.255.163 5.310.811215 Gastos Financieros 760 1.336 1.833 2.366 2.375 2.848 11.51821501 Intereses y Comisiones Deuda Externa 760 939 1.282 2.073 2.032 2.417 9.50321503 Otros Gastos Financieros 0 397 551 293 343 431 2.015216 Pago <strong>de</strong> Tributos 1.091.417 1.057.328 401.901 2.712.502 1.312.323 1.160.812 7.736.28321601 Impuestos Internos Nacionales 709.517 676.552 77.803 2.395.934 964.443 797.461 5.621.71021604 Regalías e Impuestos Hidrocarburos 381.877 380.776 324.097 316.567 347.845 363.211 2.114.37321606 Impuestos Internos Municipales 23 0 0 1 35 140 199217 Pagos Fiscales no Tributarios 0 0 9 0 0 2.098 2.107218 Transferencias Corrientes 1.743 1.569 1.715 1.775 1.800 1.885 10.48721801 Contribuciones Obligatorias Seg. Soc. 1.171 939 1.027 1.063 1.078 1.128 6.40621806 Aportes Patronales - Riesgos Profesionales 571 630 688 712 723 757 4.081219 Otros Egresos Corrientes 26 0 0 991 0 179 1.19622 GASTOS DE CAPITAL 182 3.204 90.398 27.465 154.819 140.132 416.200221 Formación <strong>de</strong> Capital 182 3.204 90.398 27.465 154.819 140.132 416.20022101 Construcciones y Mejoras 145 2.552 89.808 26.986 154.224 136.758 410.47322102 Compra <strong>de</strong> Activos Fijos Nuevos 37 652 589 480 595 3.374 5.7273 DEFICIT (-) O SUPERAVIT (+) 389.745 195.165 599.972 -72.680 -880.362 -37.394 194.446Fuente: <strong>Ministerio</strong> <strong>de</strong> <strong>Economía</strong> y <strong>Finanzas</strong> <strong>Públicas</strong>.Elaboración: MEFP-VTCP-Dirección General <strong>de</strong> Análisis y Políticas Fiscales.(p) Preliminar.