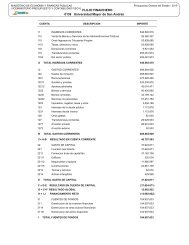
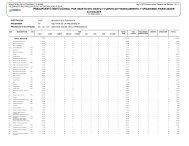
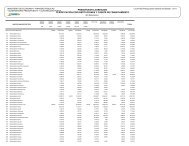
Cuadro Nº 282011: FLUJO DE CAJA DE OPERACIONES DEL TESORO GENERAL DE LA NACION(En millones <strong>de</strong> bolivianos)DETALLE ENE FEB MAR ABR MAY JUN 2011I Sem. (p)INGRESOS TOTALES 1.838,6 1.702,4 1.711,1 2.063,3 2.389,8 1.881,6 11.586,8Ingresos Corrientes 1.838,6 1.702,4 1.711,1 2.063,3 2.389,8 1.881,6 11.586,8Ingresos Tributarios 1.685,4 1.499,4 1.551,4 1.893,5 2.246,6 1.453,6 10.329,9Renta Interna 1.456,1 1.286,8 1.315,0 1.679,6 2.008,4 1.216,0 8.962,1Impuesto Directo a los Hidrocarburos 127,4 122,6 117,8 116,5 128,4 138,5 751,1Renta Aduanera 101,9 90,0 118,6 97,4 109,8 99,1 616,8Sector Hidrocarburos 127,3 169,8 109,5 105,5 115,9 121,3 749,36% Participaciones 127,3 126,9 109,5 105,5 115,9 121,3 706,5Patentes Petroleras 0,0 42,8 0,0 0,0 0,0 0,0 42,8Otros Ingresos 22,4 31,3 48,3 60,3 25,4 304,9 492,6Otros Ingresos Seguridad Social 3,6 2,0 1,9 4,0 1,8 1,8 15,0Donaciones 0,0 0,0 0,0 0,0 0,0 0,0 0,0GASTOS TOTALES 1.413,5 1.440,5 1.532,1 2.124,8 1.869,6 2.202,0 10.582,5Gasto Corriente 1.399,4 1.411,5 1.501,1 2.097,6 1.816,8 2.045,1 10.271,4Servicios Personales 696,3 695,6 700,9 835,4 788,7 1.120,1 4.836,9Sueldos 623,9 619,1 624,1 741,8 705,0 1.033,0 4.347,0Aporte Laboral 72,4 76,5 76,7 93,6 83,7 87,0 489,9Bienes y Servicios 92,0 102,7 117,4 433,0 241,8 219,5 1.206,5Intereses Deuda Externa 59,5 19,5 29,6 36,0 42,0 48,7 235,2Intereses Deuda Interna 118,2 105,9 165,9 157,1 173,8 101,2 822,2Transferencias 426,2 479,3 478,8 611,4 560,4 552,5 3.108,6Otros Gastos Reversiones 7,3 8,3 8,6 24,6 10,1 3,2 62,1Gasto <strong>de</strong> Capital 14,1 29,0 31,0 27,2 52,8 156,9 311,1SUPERAVIT O DEFICIT(-) 425,1 261,9 178,9 -61,5 520,2 -320,4 1.004,2FINANCIAMIENTO -425,1 -261,9 -178,9 61,5 -520,2 320,4 -1.004,2CREDITO INTERNO -343,9 -200,6 52,2 344,2 -397,4 560,2 14,8CREDITO EXTERNO -81,2 -61,3 -231,1 -282,8 -122,8 -239,8 -1.019,0Fuente: <strong>Ministerio</strong> <strong>de</strong> <strong>Economía</strong> y <strong>Finanzas</strong> <strong>Públicas</strong>.Elaboración: MEFP-VTCP-Dirección General <strong>de</strong> Programación y Operaciones <strong>de</strong>l Tesoro.(p) Preliminar.
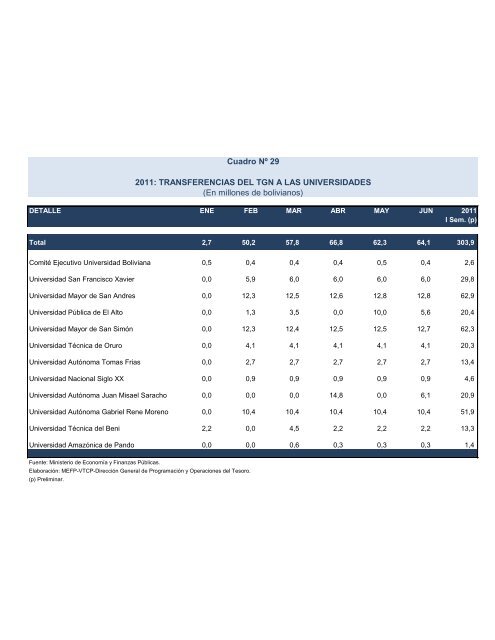
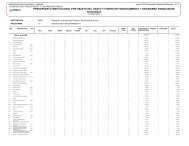
Cuadro Nº 292011: TRANSFERENCIAS DEL TGN A LAS UNIVERSIDADES(En millones <strong>de</strong> bolivianos)DETALLE ENE FEB MAR ABR MAY JUN 2011I Sem. (p)Total 2,7 50,2 57,8 66,8 62,3 64,1 303,9Comité Ejecutivo Universidad Boliviana 0,5 0,4 0,4 0,4 0,5 0,4 2,6Universidad San Francisco Xavier 0,0 5,9 6,0 6,0 6,0 6,0 29,8Universidad Mayor <strong>de</strong> San Andres 0,0 12,3 12,5 12,6 12,8 12,8 62,9Universidad Pública <strong>de</strong> El Alto 0,0 1,3 3,5 0,0 10,0 5,6 20,4Universidad Mayor <strong>de</strong> San Simón 0,0 12,3 12,4 12,5 12,5 12,7 62,3Universidad Técnica <strong>de</strong> Oruro 0,0 4,1 4,1 4,1 4,1 4,1 20,3Universidad Autónoma Tomas Frias 0,0 2,7 2,7 2,7 2,7 2,7 13,4Universidad Nacional Siglo XX 0,0 0,9 0,9 0,9 0,9 0,9 4,6Universidad Autónoma Juan Misael Saracho 0,0 0,0 0,0 14,8 0,0 6,1 20,9Universidad Autónoma Gabriel Rene Moreno 0,0 10,4 10,4 10,4 10,4 10,4 51,9Universidad Técnica <strong>de</strong>l Beni 2,2 0,0 4,5 2,2 2,2 2,2 13,3Universidad Amazónica <strong>de</strong> Pando 0,0 0,0 0,6 0,3 0,3 0,3 1,4Fuente: <strong>Ministerio</strong> <strong>de</strong> <strong>Economía</strong> y <strong>Finanzas</strong> <strong>Públicas</strong>.Elaboración: MEFP-VTCP-Dirección General <strong>de</strong> Programación y Operaciones <strong>de</strong>l Tesoro.(p) Preliminar.