Untitled - Ministerio de Economía y Finanzas Públicas
Untitled - Ministerio de Economía y Finanzas Públicas
Untitled - Ministerio de Economía y Finanzas Públicas
- No tags were found...

Create successful ePaper yourself
Turn your PDF publications into a flip-book with our unique Google optimized e-Paper software.
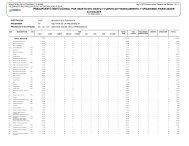
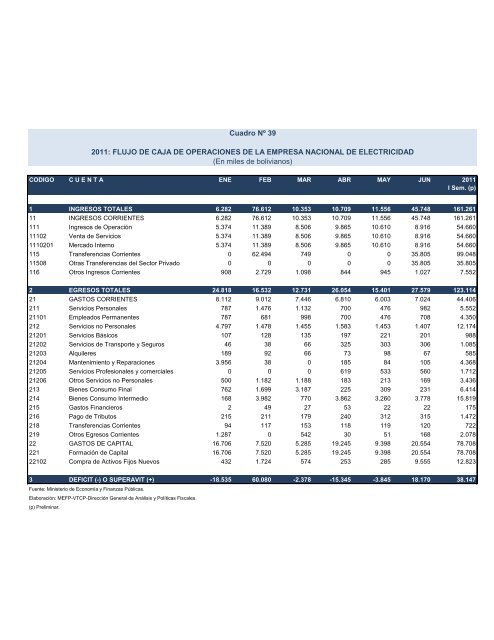
Cuadro Nº 392011: FLUJO DE CAJA DE OPERACIONES DE LA EMPRESA NACIONAL DE ELECTRICIDAD(En miles <strong>de</strong> bolivianos)CODIGO C U E N T A ENE FEB MAR ABR MAY JUN 2011I Sem. (p)1 INGRESOS TOTALES 6.282 76.612 10.353 10.709 11.556 45.748 161.26111 INGRESOS CORRIENTES 6.282 76.612 10.353 10.709 11.556 45.748 161.261111 Ingresos <strong>de</strong> Operación 5.374 11.389 8.506 9.865 10.610 8.916 54.66011102 Venta <strong>de</strong> Servicios 5.374 11.389 8.506 9.865 10.610 8.916 54.6601110201 Mercado Interno 5.374 11.389 8.506 9.865 10.610 8.916 54.660115 Transferencias Corrientes 0 62.494 749 0 0 35.805 99.04811508 Otras Transferencias <strong>de</strong>l Sector Privado 0 0 0 0 0 35.805 35.805116 Otros Ingresos Corrientes 908 2.729 1.098 844 945 1.027 7.5522 EGRESOS TOTALES 24.818 16.532 12.731 26.054 15.401 27.579 123.11421 GASTOS CORRIENTES 8.112 9.012 7.446 6.810 6.003 7.024 44.406211 Servicios Personales 787 1.476 1.132 700 476 982 5.55221101 Empleados Permanentes 787 681 998 700 476 708 4.350212 Servicios no Personales 4.797 1.478 1.455 1.583 1.453 1.407 12.17421201 Servicios Básicos 107 128 135 197 221 201 98821202 Servicios <strong>de</strong> Transporte y Seguros 46 38 66 325 303 306 1.08521203 Alquileres 189 92 66 73 98 67 58521204 Mantenimiento y Reparaciones 3.956 38 0 185 84 105 4.36821205 Servicios Profesionales y comerciales 0 0 0 619 533 560 1.71221206 Otros Servicios no Personales 500 1.182 1.188 183 213 169 3.436213 Bienes Consumo Final 762 1.699 3.187 225 309 231 6.414214 Bienes Consumo Intermedio 168 3.982 770 3.862 3.260 3.778 15.819215 Gastos Financieros 2 49 27 53 22 22 175216 Pago <strong>de</strong> Tributos 215 211 179 240 312 315 1.472218 Transferencias Corrientes 94 117 153 118 119 120 722219 Otros Egresos Corrientes 1.287 0 542 30 51 168 2.07822 GASTOS DE CAPITAL 16.706 7.520 5.285 19.245 9.398 20.554 78.708221 Formación <strong>de</strong> Capital 16.706 7.520 5.285 19.245 9.398 20.554 78.70822102 Compra <strong>de</strong> Activos Fijos Nuevos 432 1.724 574 253 285 9.555 12.8233 DEFICIT (-) O SUPERAVIT (+) -18.535 60.080 -2.378 -15.345 -3.845 18.170 38.147Fuente: <strong>Ministerio</strong> <strong>de</strong> <strong>Economía</strong> y <strong>Finanzas</strong> <strong>Públicas</strong>.Elaboración: MEFP-VTCP-Dirección General <strong>de</strong> Análisis y Políticas Fiscales.(p) Preliminar.