Untitled - Ministerio de Economía y Finanzas Públicas
Untitled - Ministerio de Economía y Finanzas Públicas
Untitled - Ministerio de Economía y Finanzas Públicas
- No tags were found...

You also want an ePaper? Increase the reach of your titles
YUMPU automatically turns print PDFs into web optimized ePapers that Google loves.
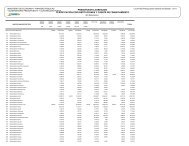
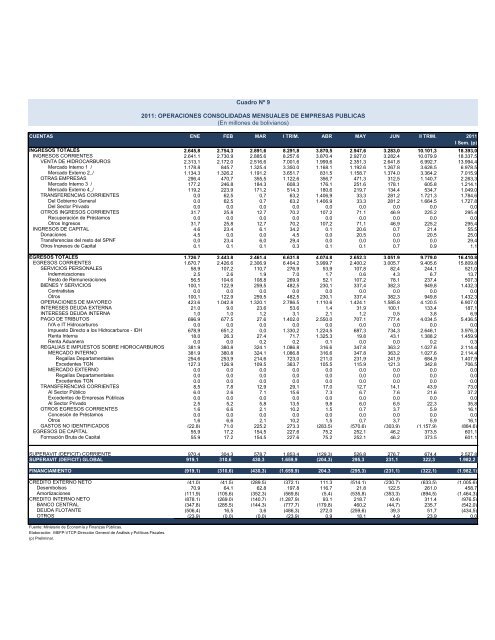
Cuadro Nº 92011: OPERACIONES CONSOLIDADAS MENSUALES DE EMPRESAS PUBLICAS(En millones <strong>de</strong> bolivianos)CUENTAS ENE FEB MAR I TRIM. ABR MAY JUN II TRIM. 2011I Sem. (p)INGRESOS TOTALES 2.645,8 2.754,3 2.891,6 8.291,8 3.870,5 2.947,6 3.283,0 10.101,3 18.393,0INGRESOS CORRIENTES 2.641,1 2.730,9 2.885,6 8.257,6 3.870,4 2.927,0 3.282,4 10.079,9 18.337,5VENTA DE HIDROCARBUROS 2.313,1 2.172,0 2.516,6 7.001,6 1.999,6 2.351,3 2.641,8 6.992,7 13.994,4Mercado Interno 1_/ 1.178,8 845,7 1.325,4 3.350,0 1.168,1 1.192,6 1.267,8 3.628,5 6.978,5Mercado Externo 2_/ 1.134,3 1.326,2 1.191,2 3.651,7 831,5 1.158,7 1.374,0 3.364,2 7.015,9OTRAS EMPRESAS 296,4 470,7 355,5 1.122,6 356,7 471,3 312,5 1.140,7 2.263,3Mercado Interno 3_/ 177,2 246,8 184,3 608,3 176,1 251,6 178,1 605,8 1.214,1Mercado Externo 4_/ 119,2 223,9 171,2 514,3 180,6 219,7 134,4 534,7 1.049,0TRANSFERENCIAS CORRIENTES 0,0 62,5 0,7 63,2 1.406,9 33,3 281,2 1.721,3 1.784,6Del Gobierno General 0,0 62,5 0,7 63,2 1.406,9 33,3 281,2 1.664,5 1.727,8Del Sector Privado 0,0 0,0 0,0 0,0 0,0 0,0 0,0 0,0 0,0OTROS INGRESOS CORRIENTES 31,7 25,8 12,7 70,2 107,2 71,1 46,9 225,2 295,4Recuperación <strong>de</strong> Préstamos 0,0 0,0 0,0 0,0 0,0 0,0 0,0 0,0 0,0Otros Ingresos 31,7 25,8 12,7 70,2 107,2 71,1 46,9 225,2 295,4INGRESOS DE CAPITAL 4,6 23,4 6,1 34,2 0,1 20,6 0,7 21,4 55,5Donaciones 4,5 0,0 0,0 4,5 0,0 20,5 0,0 20,5 25,0Transferencias <strong>de</strong>l resto <strong>de</strong>l SPNF 0,0 23,4 6,0 29,4 0,0 0,0 0,0 0,0 29,4Otros Ingresos <strong>de</strong> Capital 0,1 0,1 0,1 0,3 0,1 0,1 0,7 0,9 1,1EGRESOS TOTALES 1.726,7 2.443,8 2.461,4 6.631,8 4.074,8 2.652,3 3.051,9 9.779,0 16.410,8EGRESOS CORRIENTES 1.670,7 2.426,6 2.306,9 6.404,2 3.999,7 2.400,2 3.005,7 9.405,6 15.809,8SERVICIOS PERSONALES 58,9 107,2 110,7 276,9 53,9 107,8 82,4 244,1 521,0In<strong>de</strong>mnizaciones 2,5 2,6 1,9 7,0 1,7 0,6 4,3 6,7 13,7Resto <strong>de</strong> Remuneraciones 56,5 104,6 108,8 269,9 52,1 107,2 78,1 237,4 507,3BIENES Y SERVICIOS 100,1 122,9 259,5 482,5 230,1 337,4 382,3 949,8 1.432,3Contratistas 0,0 0,0 0,0 0,0 0,0 0,0 0,0 0,0 0,0Otros 100,1 122,9 259,5 482,5 230,1 337,4 382,3 949,8 1.432,3OPERACIONES DE MAYOREO 423,6 1.042,8 1.320,1 2.786,5 1.110,6 1.424,1 1.585,8 4.120,5 6.907,0INTERESES DEUDA EXTERNA 21,0 9,0 23,6 53,6 1,4 31,9 100,1 133,4 187,1INTERESES DEUDA INTERNA 1,0 1,0 1,2 3,1 2,1 1,2 0,5 3,8 6,9PAGO DE TRIBUTOS 696,9 677,5 27,6 1.402,0 2.550,0 707,1 777,4 4.034,5 5.436,5IVA e IT Hidrocarburos 0,0 0,0 0,0 0,0 0,0 0,0 0,0 0,0 0,0Impuesto Directo a los Hidrocarburos - IDH 678,9 651,2 0,0 1.330,2 1.224,5 687,3 734,3 2.646,1 3.976,3Renta Interna 18,0 26,3 27,4 71,7 1.325,3 19,8 43,1 1.388,2 1.459,9Renta Aduanera 0,0 0,0 0,2 0,2 0,1 0,0 0,0 0,2 0,3REGALIAS E IMPUESTOS SOBRE HIDROCARBUROS 381,9 380,8 324,1 1.086,8 316,6 347,8 363,2 1.027,6 2.114,4MERCADO INTERNO 381,9 380,8 324,1 1.086,8 316,6 347,8 363,2 1.027,6 2.114,4Regalías Departamentales 254,6 253,9 214,6 723,0 211,0 231,9 241,9 684,9 1.407,9Exce<strong>de</strong>ntes TGN 127,3 126,9 109,5 363,7 105,5 115,9 121,3 342,8 706,5MERCADO EXTERNO 0,0 0,0 0,0 0,0 0,0 0,0 0,0 0,0 0,0Regalías Departamentales 0,0 0,0 0,0 0,0 0,0 0,0 0,0 0,0 0,0Exce<strong>de</strong>ntes TGN 0,0 0,0 0,0 0,0 0,0 0,0 0,0 0,0 0,0TRANSFERENCIAS CORRIENTES 8,5 7,8 12,9 29,1 17,0 12,7 14,1 43,9 73,0Al Sector Público 6,0 2,6 7,1 15,6 7,3 6,7 7,6 21,6 37,2Exce<strong>de</strong>ntes <strong>de</strong> Empresas <strong>Públicas</strong> 0,0 0,0 0,0 0,0 0,0 0,0 0,0 0,0 0,0Al Sector Privado 2,5 5,2 5,8 13,5 9,8 6,0 6,5 22,3 35,8OTROS EGRESOS CORRIENTES 1,6 6,6 2,1 10,2 1,5 0,7 3,7 5,9 16,1Concesión <strong>de</strong> Préstamos 0,0 0,0 0,0 0,0 0,0 0,0 0,0 0,0 0,0Otros 1,6 6,6 2,1 10,2 1,5 0,7 3,7 5,9 16,1GASTOS NO IDENTIFICADOS (22,8) 71,0 225,2 273,3 (283,5) (570,6) (303,9) (1.157,9) (884,6)EGRESOS DE CAPITAL 55,9 17,2 154,5 227,6 75,2 252,1 46,2 373,5 601,1Formación Bruta <strong>de</strong> Capital 55,9 17,2 154,5 227,6 75,2 252,1 46,2 373,5 601,1SUPERAVIT (DEFICIT) CORRIENTE 970,4 304,3 578,7 1.853,4 (129,3) 526,8 276,7 674,4 2.527,8SUPERAVIT (DEFICIT) GLOBAL 919,1 310,6 430,3 1.659,9 (204,3) 295,3 231,1 322,3 1.982,2FINANCIAMIENTO (919,1) (310,6) (430,3) (1.659,9) 204,3 (295,3) (231,1) (322,1) (1.982,1)CREDITO EXTERNO NETO (41,0) (41,5) (289,5) (372,1) 111,3 (514,1) (230,7) (633,5) (1.005,6)Desembolsos 70,9 64,1 62,8 197,8 116,7 21,8 122,5 261,0 458,7Amortizaciones (111,9) (105,6) (352,3) (569,8) (5,4) (535,8) (353,3) (894,5) (1.464,3)CREDITO INTERNO NETO (878,1) (269,0) (140,7) (1.287,9) 93,1 218,7 (0,4) 311,4 (976,5)BANCO CENTRAL (347,8) (285,5) (144,3) (777,7) (179,8) 460,2 (44,7) 235,7 (542,0)DEUDA FLOTANTE (506,4) 16,5 3,6 (486,3) 272,0 (259,6) 39,3 51,7 (434,5)OTROS (23,9) (0,0) (0,0) (23,9) 0,9 18,1 4,9 23,9 0,0Fuente: <strong>Ministerio</strong> <strong>de</strong> <strong>Economía</strong> y <strong>Finanzas</strong> <strong>Públicas</strong>.Elaboración: MEFP-VTCP-Dirección General <strong>de</strong> Análisis y Políticas Fiscales.(p) Preliminar.