Untitled - Ministerio de Economía y Finanzas Públicas
Untitled - Ministerio de Economía y Finanzas Públicas
Untitled - Ministerio de Economía y Finanzas Públicas
- No tags were found...

You also want an ePaper? Increase the reach of your titles
YUMPU automatically turns print PDFs into web optimized ePapers that Google loves.
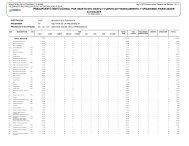
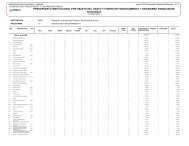
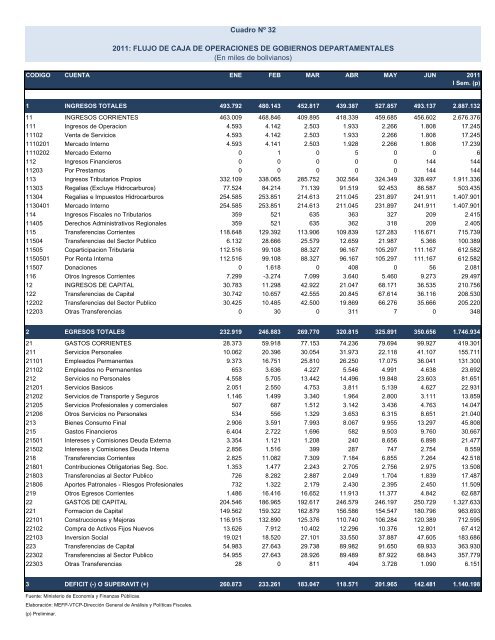
Cuadro Nº 322011: FLUJO DE CAJA DE OPERACIONES DE GOBIERNOS DEPARTAMENTALES(En miles <strong>de</strong> bolivianos)CODIGO CUENTA ENE FEB MAR ABR MAY JUN 2011I Sem. (p)1 INGRESOS TOTALES 493.792 480.143 452.817 439.387 527.857 493.137 2.887.13211 INGRESOS CORRIENTES 463.009 468.846 409.895 418.339 459.685 456.602 2.676.376111 Ingresos <strong>de</strong> Operacion 4.593 4.142 2.503 1.933 2.266 1.808 17.24511102 Venta <strong>de</strong> Servicios 4.593 4.142 2.503 1.933 2.266 1.808 17.2451110201 Mercado Interno 4.593 4.141 2.503 1.928 2.266 1.808 17.2391110202 Mercado Externo 0 1 0 5 0 0 6112 Ingresos Financieros 0 0 0 0 0 144 14411203 Por Prestamos 0 0 0 0 0 144 144113 Ingresos Tributarios Propios 332.109 338.065 285.752 302.564 324.349 328.497 1.911.33611303 Regalias (Excluye Hidrocarburos) 77.524 84.214 71.139 91.519 92.453 86.587 503.43511304 Regalias e Impuestos Hidrocarburos 254.585 253.851 214.613 211.045 231.897 241.911 1.407.9011130401 Mercado Interno 254.585 253.851 214.613 211.045 231.897 241.911 1.407.901114 Ingresos Fiscales no Tributarios 359 521 635 363 327 209 2.41511405 Derechos Administrativos Regionales 359 521 635 362 318 209 2.405115 Transferencias Corrientes 118.648 129.392 113.906 109.839 127.283 116.671 715.73911504 Transferencias <strong>de</strong>l Sector Publico 6.132 28.666 25.579 12.659 21.987 5.366 100.38911505 Coparticipacion Tributaria 112.516 99.108 88.327 96.167 105.297 111.167 612.5821150501 Por Renta Interna 112.516 99.108 88.327 96.167 105.297 111.167 612.58211507 Donaciones 0 1.618 0 408 0 56 2.081116 Otros Ingresos Corrientes 7.299 -3.274 7.099 3.640 5.460 9.273 29.49712 INGRESOS DE CAPITAL 30.783 11.298 42.922 21.047 68.171 36.535 210.756122 Transferencias <strong>de</strong> Capital 30.742 10.657 42.555 20.845 67.614 36.116 208.53012202 Transferencias <strong>de</strong>l Sector Publico 30.425 10.485 42.500 19.869 66.276 35.666 205.22012203 Otras Transferencias 0 30 0 311 7 0 3482 EGRESOS TOTALES 232.919 246.883 269.770 320.815 325.891 350.656 1.746.93421 GASTOS CORRIENTES 28.373 59.918 77.153 74.236 79.694 99.927 419.301211 Servicios Personales 10.062 20.396 30.054 31.973 22.118 41.107 155.71121101 Empleados Permanentes 9.373 16.751 25.810 26.250 17.075 36.041 131.30021102 Empleados no Permanentes 653 3.636 4.227 5.546 4.991 4.638 23.692212 Servicios no Personales 4.558 5.705 13.442 14.496 19.848 23.603 81.65121201 Servicios Basicos 2.051 2.550 4.753 3.811 5.139 4.627 22.93121202 Servicios <strong>de</strong> Transporte y Seguros 1.146 1.499 3.340 1.964 2.800 3.111 13.85921205 Servicios Profesionales y comerciales 507 687 1.512 3.142 3.436 4.763 14.04721206 Otros Servicios no Personales 534 556 1.329 3.653 6.315 8.651 21.040213 Bienes Consumo Final 2.906 3.591 7.993 8.067 9.955 13.297 45.808215 Gastos Financieros 6.404 2.722 1.696 582 9.503 9.760 30.66721501 Intereses y Comisiones Deuda Externa 3.354 1.121 1.208 240 8.656 6.898 21.47721502 Intereses y Comisiones Deuda Interna 2.856 1.516 399 287 747 2.754 8.559218 Transferencias Corrientes 2.825 11.082 7.309 7.184 6.855 7.264 42.51821801 Contribuciones Obligatorias Seg. Soc. 1.353 1.477 2.243 2.705 2.756 2.975 13.50821803 Transferencias al Sector Publico 726 8.282 2.887 2.049 1.704 1.839 17.48721806 Aportes Patronales - Riesgos Profesionales 732 1.322 2.179 2.430 2.395 2.450 11.509219 Otros Egresos Corrientes 1.486 16.416 16.652 11.913 11.377 4.842 62.68722 GASTOS DE CAPITAL 204.546 186.965 192.617 246.579 246.197 250.729 1.327.633221 Formacion <strong>de</strong> Capital 149.562 159.322 162.879 156.586 154.547 180.796 963.69322101 Construcciones y Mejoras 116.915 132.890 125.376 110.740 106.284 120.389 712.59522102 Compra <strong>de</strong> Activos Fijos Nuevos 13.626 7.912 10.402 12.296 10.376 12.801 67.41222103 Inversion Social 19.021 18.520 27.101 33.550 37.887 47.605 183.686223 Transferencias <strong>de</strong> Capital 54.983 27.643 29.738 89.982 91.650 69.933 363.93022302 Transferencias al Sector Publico 54.955 27.643 28.926 89.489 87.922 68.843 357.77922303 Otras Transferencias 28 0 811 494 3.728 1.090 6.1513 DEFICIT (-) O SUPERAVIT (+) 260.873 233.261 183.047 118.571 201.965 142.481 1.140.198Fuente: <strong>Ministerio</strong> <strong>de</strong> <strong>Economía</strong> y <strong>Finanzas</strong> <strong>Públicas</strong>.Elaboración: MEFP-VTCP-Dirección General <strong>de</strong> Análisis y Políticas Fiscales.(p) Preliminar.