Cuadro Nº 12OPERACIONES CONSOLIDADAS DE EMPRESAS PUBLICAS(En porcentaje <strong>de</strong>l PIB)CUENTAS 2001 2002 2003 2004 2005 2006 2007 2008 2009 2010 (p) 2011I Sem. (p)INGRESOS TOTALES 6,6 4,1 5,0 2,4 1,4 6,8 17,7 28,4 24,8 23,0 11,5INGRESOS CORRIENTES 6,5 4,0 5,0 2,4 1,4 6,8 17,6 28,1 24,5 22,9 11,4VENTA DE HIDROCARBUROS 5,6 3,2 4,4 1,7 0,8 4,3 12,8 21,8 20,8 19,1 8,7Mercado Interno 1_/ 3,1 0,6 0,5 0,6 0,8 4,3 8,1 9,5 11,4 10,3 4,4Mercado Externo 2_/ 2,5 2,6 3,9 1,2 0,0 0,0 4,7 12,3 9,4 8,8 4,4OTRAS EMPRESAS 0,4 0,3 0,3 0,3 0,3 0,3 1,8 2,0 1,9 2,5 1,4Mercado Interno 3_/ 0,2 0,3 0,2 0,2 0,2 0,2 0,9 0,9 0,9 1,2 0,8Mercado Externo 4_/ 0,1 0,1 0,1 0,1 0,1 0,1 0,9 1,1 1,0 1,3 0,7TRANSFERENCIAS CORRIENTES 0,4 0,2 0,1 0,1 0,1 0,4 0,6 3,8 1,5 1,0 1,1Del Gobierno General 0,3 0,2 0,1 0,1 0,1 0,3 0,6 3,8 1,4 1,0 1,1Del Sector Privado 0,0 0,0 0,0 0,0 0,0 0,0 0,0 0,0 0,0 0,0 0,0OTROS INGRESOS CORRIENTES 0,3 0,3 0,2 0,2 0,2 1,8 2,4 0,5 0,3 0,2 0,2Recuperación <strong>de</strong> Préstamos 0,0 0,0 0,0 0,0 0,0 0,0 0,0 0,0 0,0 0,0 0,0Otros Ingresos 0,3 0,3 0,2 0,2 0,2 1,8 2,4 0,5 0,3 0,2 0,2INGRESOS DE CAPITAL 0,0 0,0 0,0 0,0 0,0 0,1 0,1 0,3 0,3 0,1 0,0Donaciones 0,0 0,0 0,0 0,0 0,0 0,0 0,0 0,0 0,0 0,1 0,0Transferencias <strong>de</strong>l resto <strong>de</strong>l SPNF 0,0 0,0 0,0 0,0 0,0 0,0 0,1 0,3 0,3 0,1 0,0Otros Ingresos <strong>de</strong> Capital 0,0 0,0 0,0 0,0 0,0 0,0 0,0 0,0 0,0 0,0 0,0EGRESOS TOTALES 6,1 4,0 5,2 2,3 1,3 5,8 18,2 25,2 22,7 21,3 10,2EGRESOS CORRIENTES 6,0 3,9 5,1 2,2 1,2 5,7 17,2 23,2 21,5 20,4 9,9SERVICIOS PERSONALES 0,4 0,3 0,3 0,2 0,2 0,2 0,5 0,7 0,7 0,7 0,3In<strong>de</strong>mnizaciones 0,1 0,0 0,0 0,0 0,0 0,0 0,0 0,0 0,0 0,0 0,0Resto <strong>de</strong> Remuneraciones 0,3 0,3 0,2 0,2 0,2 0,2 0,5 0,7 0,7 0,7 0,3BIENES Y SERVICIOS 5,7 3,5 4,7 1,9 1,0 1,4 1,3 2,0 0,9 1,9 0,9Contratistas 2,5 2,6 3,9 1,2 0,0 0,0 0,0 0,0 0,0 0,0 0,0Otros 3,2 0,9 0,9 0,8 1,0 1,4 1,3 2,0 0,9 1,9 0,9OPERACIONES DE MAYOREO 0,0 0,0 0,0 0,0 0,0 3,4 8,8 11,0 8,7 9,9 4,3INTERESES DEUDA EXTERNA 0,1 0,1 0,0 0,0 0,0 0,0 0,0 0,1 0,1 0,1 0,1INTERESES DEUDA INTERNA 0,0 0,0 0,0 0,0 0,0 0,0 0,0 0,0 0,0 0,0 0,0PAGO DE TRIBUTOS 0,0 0,0 0,0 0,0 0,0 0,1 3,8 5,7 6,2 5,1 3,4IVA e IT Hidrocarburos 0,0 0,0 0,0 0,0 0,0 0,0 0,0 0,0 0,0 0,0 0,0Impuesto Directo a los Hidrocarburos - IDH 0,0 0,0 0,0 0,0 0,0 0,0 3,6 5,5 5,3 4,9 2,5Renta Interna 0,0 0,0 0,0 0,0 0,0 0,1 0,2 0,1 0,9 0,3 0,9Renta Aduanera 0,0 0,0 0,0 0,0 0,0 0,0 0,0 0,1 0,0 0,0 0,0REGALIAS E IMPUESTOS SOBRE HIDROCARBUROS 0,0 0,0 0,0 0,0 0,0 0,0 2,2 2,9 3,0 2,8 1,3MERCADO INTERNO 0,0 0,0 0,0 0,0 0,0 0,0 2,2 2,9 3,0 2,8 1,3Regalías Departamentales 0,0 0,0 0,0 0,0 0,0 0,0 1,4 2,0 2,0 1,9 0,9Exce<strong>de</strong>ntes TGN 0,0 0,0 0,0 0,0 0,0 0,0 0,7 1,0 1,0 0,9 0,4MERCADO EXTERNO 0,0 0,0 0,0 0,0 0,0 0,0 0,0 0,0 0,0 0,0 0,0Regalías Departamentales 0,0 0,0 0,0 0,0 0,0 0,0 0,0 0,0 0,0 0,0 0,0Exce<strong>de</strong>ntes TGN 0,0 0,0 0,0 0,0 0,0 0,0 0,0 0,0 0,0 0,0 0,0TRANSFERENCIAS CORRIENTES 0,0 0,1 0,1 0,0 0,0 0,3 0,6 0,1 1,7 0,2 0,0Al Sector Público 0,0 0,0 0,0 0,0 0,0 0,0 0,2 0,1 0,1 0,2 0,0Exce<strong>de</strong>ntes <strong>de</strong> Empresas <strong>Públicas</strong> 0,0 0,0 0,0 0,0 0,0 0,0 0,0 0,0 0,0 0,0 0,0Al Sector Privado 0,0 0,0 0,0 0,0 0,0 0,3 0,4 0,0 1,7 0,1 0,0Ap. Fusión Salarios 0,0 0,0 0,0 0,0 0,0 0,0 0,0 0,0 0,0 0,0 0,0Resto 0,0 0,0 0,0 0,0 0,0 0,0 0,0 0,0 0,1 0,1 0,0OTROS EGRESOS CORRIENTES 0,0 0,0 0,0 0,0 0,0 0,0 0,1 0,1 0,0 0,0 0,0Concesión <strong>de</strong> Préstamos 0,0 0,0 0,0 0,0 0,0 0,0 0,0 0,0 0,0 0,0 0,0Otros 0,0 0,0 0,0 0,0 0,0 0,0 0,1 0,1 0,0 0,0 0,0GASTOS NO IDENTIFICADOS (0,3) (0,2) (0,1) (0,1) (0,1) 0,2 0,0 0,7 0,2 (0,4) (0,6)EGRESOS DE CAPITAL 0,2 0,2 0,1 0,1 0,1 0,1 1,0 2,0 1,2 0,9 0,4Formación Bruta <strong>de</strong> Capital 0,2 0,2 0,1 0,1 0,1 0,1 1,0 2,0 1,1 0,9 0,4Transferencias al Sector Público no Financiero 0,0 0,0 0,0 0,0 0,0 0,0 0,0 0,0 0,1 0,0 0,0SUPERAVIT (DEFICIT) CORRIENTE 0,6 0,2 (0,1) 0,2 0,1 1,1 0,4 4,9 3,0 2,5 1,6SUPERAVIT (DEFICIT) GLOBAL 0,4 0,1 (0,2) 0,1 0,1 1,0 (0,5) 3,3 2,1 1,8 1,2FINANCIAMIENTO (0,4) (0,1) 0,2 (0,1) (0,1) (1,0) 0,5 (3,3) (2,1) (1,8) (1,2)CREDITO EXTERNO NETO 0,0 (0,1) (0,0) (0,1) 0,1 0,5 0,4 0,4 (0,5) (0,9) (0,6)Desembolsos 0,1 0,0 0,0 0,0 0,2 1,0 1,0 1,4 0,3 0,5 0,3Amortizaciones (0,0) (0,1) (0,0) (0,1) (0,2) (0,5) (0,6) (1,0) (0,8) (1,4) (0,9)Atrasos Argentina 0,0 0,0 0,0 0,0 0,0 0,0 0,0 0,0 0,0 0,0 (0,3)Otros (Depósitos ENTEL)/Aporte Accionario 0,0 0,0 0,0 0,0 0,0 0,0 0,0 0,0 0,0 0,0 (0,4)CREDITO INTERNO NETO (0,5) 0,0 0,2 (0,1) (0,1) (1,5) 0,1 (3,6) (1,6) (0,9) 0,0BANCO CENTRAL (0,4) 0,6 0,2 0,2 (0,0) (1,4) 0,6 (4,5) (0,7) (1,3) 0,0CONTRATISTAS 0,0 0,0 0,0 0,0 0,0 0,0 0,0 0,0 0,0 0,0 0,0DEUDA FLOTANTE (0,1) (0,1) 0,1 (0,1) (0,0) 0,0 (0,0) 0,1 (0,4) 0,4 0,0OTROS (0,0) (0,4) (0,0) (0,2) (0,1) (0,1) (0,4) 0,7 (0,6) 0,1 0,0Fuente: <strong>Ministerio</strong> <strong>de</strong> <strong>Economía</strong> y <strong>Finanzas</strong> <strong>Públicas</strong>.Elaboración: MEFP-VTCP-Dirección General <strong>de</strong> Análisis y Políticas Fiscales.1_/ Des<strong>de</strong> Mayo <strong>de</strong> 2006, YPFB realiza operaciones <strong>de</strong> mayorista.2_/ Des<strong>de</strong> 2005 no se registran venta mercado externo y contratistas por tratarse <strong>de</strong> operaciones <strong>de</strong> empresas capitalizadas. Des<strong>de</strong> 2007 se incluye la facturación <strong>de</strong> la venta <strong>de</strong> gas y petróleo <strong>de</strong> YPFB.3_/ En Mayo <strong>de</strong> 2007 por el D.S. 29117 se <strong>de</strong>terminó que COMIBOL explote la reserva fiscal, que actualmente incluye las operaciones mineras en Huanuni.4_/ Mediante D.S. 29026 en Febrero 2007 se nacionalizó la Empresa Metalúrgica Vinto, asumiendo nuevamente operaciones como entidad estatal <strong>de</strong>s<strong>de</strong> su transferencia al sector privado en 1999.(p) Preliminar.
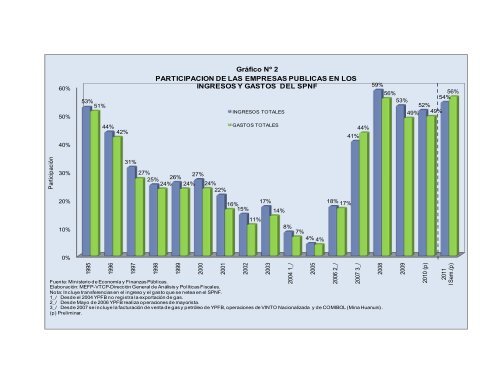
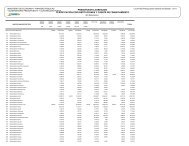
Participación1995199619971998199920002001200220032004 1_/20052006 2_/2007 3_/200820092010 (p)2011I Sem.(p)60%50%53%51%Gráfico Nº 2PARTICIPACION DE LAS EMPRESAS PUBLICAS EN LOSINGRESOS Y GASTOS DEL SPNFINGRESOS TOTALES59%56%56%54%53%52%49% 49%44%42%GASTOS TOTALES41%44%40%31%30%27%25% 26% 27% 24% 24% 24%22%20%16%15%17%14%18% 17%10%11%8%7%4% 4%0%Fuente: <strong>Ministerio</strong> <strong>de</strong> <strong>Economía</strong> y <strong>Finanzas</strong> <strong>Públicas</strong>.Elaboración: MEFP-VTCP-Dirección General <strong>de</strong> Análisis y Políticas Fiscales.Nota: Incluye transferencias en el ingreso y el gasto que se netea en el SPNF.1_/ Des<strong>de</strong> el 2004 YPFB no registra la exportación <strong>de</strong> gas.2_/ Des<strong>de</strong> Mayo <strong>de</strong> 2006 YPFB realiza operaciones <strong>de</strong> mayorista.3_/ Des<strong>de</strong> 2007 se incluye la facturación <strong>de</strong> venta <strong>de</strong> gas y petróleo <strong>de</strong> YPFB, operaciones <strong>de</strong> VINTO Nacionalizada y <strong>de</strong> COMIBOL (Mina Huanuni) .(p) Preliminar.