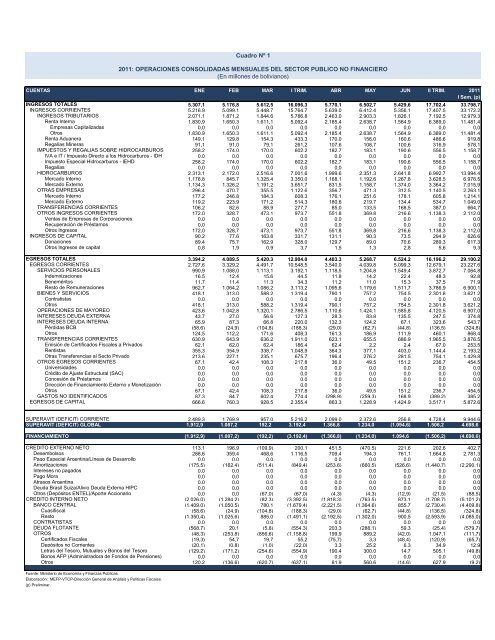
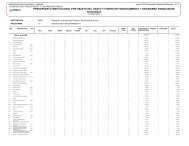
Cuadro Nº 12011: OPERACIONES CONSOLIDADAS MENSUALES DEL SECTOR PUBLICO NO FINANCIERO(En millones <strong>de</strong> bolivianos)CUENTAS ENE FEB MAR I TRIM. ABR MAY JUN II TRIM. 2011I Sem. (p)INGRESOS TOTALES 5.307,1 5.176,8 5.612,5 16.096,3 5.770,1 6.502,7 5.429,6 17.702,4 33.798,7INGRESOS CORRIENTES 5.216,9 5.099,1 5.448,7 15.764,7 5.639,0 6.412,4 5.356,1 17.407,5 33.172,2INGRESOS TRIBUTARIOS 2.071,1 1.871,2 1.844,6 5.786,8 2.463,0 2.903,3 1.826,1 7.192,5 12.979,3Renta Interna 1.830,9 1.650,3 1.611,1 5.092,4 2.185,4 2.638,7 1.564,9 6.389,0 11.481,4Empresas Capitalizadas 0,0 0,0 0,0 0,0 0,0 0,0 0,0 0,0 0,0Otros 1.830,9 1.650,3 1.611,1 5.092,4 2.185,4 2.638,7 1.564,9 6.389,0 11.481,4Renta Aduanera 149,1 129,8 154,3 433,3 170,0 156,0 160,6 486,6 919,8Regalías Mineras 91,1 91,0 79,1 261,2 107,6 108,7 100,6 316,9 578,1IMPUESTOS Y REGALIAS SOBRE HIDROCARBUROS 258,2 174,0 170,0 602,2 182,7 183,1 190,6 556,5 1.158,7IVA e IT / Impuesto Directo a los Hidrocarburos - IDH 0,0 0,0 0,0 0,0 0,0 0,0 0,0 0,0 0,0Impuesto Especial Hidrocarburos - IEHD 258,2 174,0 170,0 602,2 182,7 183,1 190,6 556,5 1.158,7Regalías 0,0 0,0 0,0 0,0 0,0 0,0 0,0 0,0 0,0HIDROCARBUROS 2.313,1 2.172,0 2.516,6 7.001,6 1.999,6 2.351,3 2.641,8 6.992,7 13.994,4Mercado Interno 1.178,8 845,7 1.325,4 3.350,0 1.168,1 1.192,6 1.267,8 3.628,5 6.978,5Mercado Externo 1.134,3 1.326,2 1.191,2 3.651,7 831,5 1.158,7 1.374,0 3.364,2 7.015,9OTRAS EMPRESAS 296,4 470,7 355,5 1.122,6 356,7 471,3 312,5 1.140,5 2.263,1Mercado Interno 177,2 246,8 184,3 608,3 176,1 251,6 178,1 605,8 1.214,1Mercado Externo 119,2 223,9 171,2 514,3 180,6 219,7 134,4 534,7 1.049,0TRANSFERENCIAS CORRIENTES 106,2 82,6 88,9 277,7 85,0 133,5 168,5 387,0 664,7OTROS INGRESOS CORRIENTES 172,0 328,7 473,1 973,7 551,8 369,8 216,6 1.138,3 2.112,0Ventas <strong>de</strong> Empresas <strong>de</strong> Corporaciones 0,0 0,0 0,0 0,0 0,0 0,0 0,0 0,0 0,0Recuperación <strong>de</strong> Préstamos 0,0 0,0 0,0 0,0 0,0 0,0 0,0 0,0 0,0Otros Ingresos 172,0 328,7 473,1 973,7 551,8 369,8 216,6 1.138,3 2.112,0INGRESOS DE CAPITAL 90,2 77,6 163,8 331,7 131,1 90,3 73,5 294,9 626,6Donaciones 89,4 75,7 162,9 328,0 129,7 89,0 70,6 289,3 617,3Otros Ingresos <strong>de</strong> capital 0,8 1,9 0,9 3,7 1,5 1,3 2,8 5,6 9,3EGRESOS TOTALES 3.394,2 4.089,5 5.420,3 12.904,0 4.403,3 5.268,7 6.524,2 16.196,2 29.100,2EGRESOS CORRIENTES 2.727,6 3.329,2 4.491,7 10.548,5 3.540,0 4.039,8 5.099,3 12.679,1 23.227,6SERVICIOS PERSONALES 990,9 1.088,0 1.113,1 3.192,1 1.118,5 1.204,8 1.549,4 3.872,7 7.064,8In<strong>de</strong>mnizaciones 16,5 12,4 15,6 44,5 11,8 14,2 22,4 48,3 92,8Beneméritos 11,7 11,4 11,3 34,3 11,2 11,0 15,3 37,5 71,9Resto <strong>de</strong> Remuneraciones 962,7 1.064,2 1.086,2 3.113,2 1.095,6 1.179,6 1.511,7 3.786,9 6.900,1BIENES Y SERVICIOS 418,1 313,0 588,2 1.319,4 790,1 757,2 754,5 2.301,8 3.621,2Contratistas 0,0 0,0 0,0 0,0 0,0 0,0 0,0 0,0 0,0Otros 418,1 313,0 588,2 1.319,4 790,1 757,2 754,5 2.301,8 3.621,2OPERACIONES DE MAYOREO 423,6 1.042,8 1.320,1 2.786,5 1.110,6 1.424,1 1.585,8 4.120,5 6.907,0INTERESES DEUDA EXTERNA 43,7 27,0 56,6 127,3 28,3 83,8 135,5 247,5 374,8INTERESES DEUDA INTERNA 65,9 87,3 66,8 220,0 132,3 124,2 67,1 323,6 543,7Pérdidas BCB (58,6) (24,9) (104,8) (188,3) (29,0) (62,7) (44,8) (136,5) (324,8)Otros 124,5 112,2 171,6 408,3 161,3 186,9 111,9 460,1 868,4TRANSFERENCIAS CORRIENTES 630,9 643,9 636,2 1.911,0 623,1 655,5 686,9 1.965,5 3.876,5Emisión <strong>de</strong> Certificados Fiscales a Privados 62,1 62,0 62,4 186,4 62,4 2,2 2,4 67,0 253,5Rentistas 355,3 354,9 338,7 1.048,9 364,3 377,1 403,0 1.144,4 2.193,2Otras Transferencias al Secto Privado 213,6 227,1 235,1 675,7 196,4 276,2 281,5 754,1 1.429,8OTROS EGRESOS CORRIENTES 67,1 42,4 108,3 217,8 36,0 49,5 151,2 236,7 454,5Universida<strong>de</strong>s 0,0 0,0 0,0 0,0 0,0 0,0 0,0 0,0 0,0Crédito <strong>de</strong> Ajuste Estructural (SAC) 0,0 0,0 0,0 0,0 0,0 0,0 0,0 0,0 0,0Concesión <strong>de</strong> Préstamos 0,0 0,0 0,0 0,0 0,0 0,0 0,0 0,0 0,0Dirección <strong>de</strong> Financiamiento Externo y Monetización 0,0 0,0 0,0 0,0 0,0 0,0 0,0 0,0 0,0Otros 67,1 42,4 108,3 217,8 36,0 49,5 151,2 236,7 454,5GASTOS NO IDENTIFICADOS 87,3 84,7 602,4 774,4 (298,9) (259,3) 168,9 (389,2) 385,2EGRESOS DE CAPITAL 666,6 760,3 928,5 2.355,4 863,3 1.228,9 1.424,9 3.517,1 5.872,6SUPERAVIT (DEFICIT) CORRIENTE 2.489,3 1.769,9 957,0 5.216,2 2.099,0 2.372,6 256,8 4.728,4 9.944,6SUPERAVIT (DEFICIT) GLOBAL 1.912,9 1.087,2 192,2 3.192,4 1.366,8 1.234,0 (1.094,6) 1.506,2 4.698,6FINANCIAMIENTO (1.912,9) (1.087,2) (192,2) (3.192,4) (1.366,8) (1.234,0) 1.094,6 (1.506,2) (4.698,6)CREDITO EXTERNO NETO 113,1 196,9 (109,9) 200,1 451,5 (470,5) 221,6 202,6 402,7Desembolsos 288,6 359,4 468,6 1.116,5 709,4 194,3 761,1 1.664,8 2.781,3Pago Especial Argentina/Líneas <strong>de</strong> Desarrollo 0,0 0,0 0,0 0,0 0,0 0,0 0,0 0,0 0,0Amortizaciones (175,5) (162,4) (511,4) (849,4) (253,6) (660,5) (526,6) (1.440,7) (2.290,1)Intereses no pagados 0,0 0,0 0,0 0,0 0,0 0,0 0,0 0,0 0,0Pago Mora 0,0 0,0 0,0 0,0 0,0 0,0 0,0 0,0 0,0Atrasos Argentina 0,0 0,0 0,0 0,0 0,0 0,0 0,0 0,0 0,0Deuda Brasil Suiza/Alivio Deuda Externa HIPC 0,0 0,0 0,0 0,0 0,0 0,0 0,0 0,0 0,0Otros (Depósitos ENTEL)/Aporte Accionario 0,0 0,0 (67,0) (67,0) (4,3) (4,3) (12,9) (21,5) (88,5)CREDITO INTERNO NETO (2.026,0) (1.284,2) (82,3) (3.392,5) (1.818,3) (763,5) 873,1 (1.708,7) (5.101,2)BANCO CENTRAL (1.409,0) (1.050,5) 780,1 (1.679,4) (2.221,5) (1.364,6) 855,7 (2.730,4) (4.409,8)Cuasifiscal (58,6) (24,9) (104,8) (188,3) (29,0) (62,7) (44,8) (136,5) (324,8)Resto (1.350,4) (1.025,6) 885,0 (1.491,1) (2.192,5) (1.302,0) 900,5 (2.593,9) (4.085,0)CONTRATISTAS 0,0 0,0 0,0 0,0 0,0 0,0 0,0 0,0 0,0DEUDA FLOTANTE (568,7) 20,1 (5,8) (554,3) 203,3 (288,1) 59,3 (25,4) (579,7)OTROS (48,3) (253,8) (856,6) (1.158,8) 199,9 889,2 (42,0) 1.047,1 (111,7)Certificados Fiscales (19,3) 54,7 19,7 55,2 (75,7) 3,3 (48,4) (120,9) (65,7)Depósitos no Corrientes (20,1) (0,8) (1,0) (22,0) 3,3 25,2 6,3 34,9 12,9Letras <strong>de</strong>l Tesoro, Mutuales y Bonos <strong>de</strong>l Tesoro (129,2) (171,2) (254,6) (554,9) 190,4 300,0 14,7 505,1 (49,8)Bonos AFP (Administradora <strong>de</strong> Fondos <strong>de</strong> Pensiones) 0,0 0,0 0,0 0,0 0,0 0,0 0,0 0,0 0,0Otros 120,2 (136,6) (620,7) (637,1) 81,9 560,6 (14,6) 627,9 (9,2)Fuente: <strong>Ministerio</strong> <strong>de</strong> <strong>Economía</strong> y <strong>Finanzas</strong> <strong>Públicas</strong>.Elaboración: MEFP-VTCP-Dirección General <strong>de</strong> Análisis y Políticas Fiscales.(p) Preliminar.
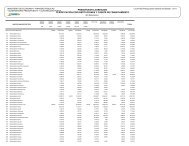
Cuadro Nº 2OPERACIONES CONSOLIDADAS DEL SECTOR PUBLICO NO FINANCIERO(En millones <strong>de</strong> bolivianos)CUENTAS 1990 1991 1992 1993 1994 1995 1996 1997 1998 1999 2000INGRESOS TOTALES 4.752,7 6.197,0 7.297,7 7.620,5 9.248,7 10.444,8 11.428,7 12.684,9 14.653,9 15.703,3 17.498,7INGRESOS CORRIENTES 4.438,3 5.789,0 6.630,4 7.202,3 8.499,5 9.670,1 10.405,6 11.675,9 13.683,4 14.430,3 16.043,4INGRESOS TRIBUTARIOS 1.073,0 1.365,3 1.951,1 2.278,8 2.865,9 3.608,2 4.334,1 5.361,3 6.622,7 6.390,4 7.031,2Renta Interna 867,6 1.157,5 1.687,8 1.986,8 2.495,1 3.179,9 3.852,9 4.718,6 5.859,3 5.718,6 6.328,6Empresas Capitalizadas 0,0 0,0 0,0 0,0 0,0 0,0 0,0 0,0 0,0 0,0 0,0Otros 867,6 1.157,5 1.687,8 1.986,8 2.495,1 3.179,9 3.852,9 4.718,6 5.859,3 5.718,6 6.328,6Renta Aduanera 188,8 195,8 252,1 279,9 370,8 411,9 455,8 584,4 715,4 629,0 653,3Regalías Mineras 16,5 12,0 11,1 12,0 0,0 16,3 25,3 58,3 48,0 42,7 49,3IMPUESTOS Y REGALIAS SOBRE HIDROCARBUROS 0,0 0,0 0,0 0,0 0,0 0,0 47,4 1.223,4 2.193,6 2.231,8 2.650,5IVA e IT / Impuesto Directo a los Hidrocarburos - IDH 1_/ 0,0 0,0 0,0 0,0 0,0 0,0 0,0 268,4 378,3 410,6 94,4Impuesto Especial Hidrocarburos - IEHD 0,0 0,0 0,0 0,0 0,0 0,0 47,4 546,5 1.092,6 1.188,3 1.358,2Regalías 0,0 0,0 0,0 0,0 0,0 0,0 0,0 408,4 722,6 633,0 1.198,0HIDROCARBUROS 1.861,4 2.555,2 2.490,4 2.407,7 2.549,9 2.842,6 3.337,0 2.345,8 2.351,1 2.604,7 4.012,4Mercado Interno 2_/ 1.158,7 1.671,9 1.872,1 1.999,9 2.107,9 2.291,0 2.848,7 1.954,7 1.913,5 2.262,1 3.448,2Mercado Externo 3_/ 702,6 883,3 618,3 407,8 442,0 551,6 488,3 391,1 437,6 342,6 564,2OTRAS EMPRESAS 924,4 1.180,7 1.368,4 1.459,4 1.733,4 1.705,6 916,6 731,5 509,8 625,2 290,3Mercado Interno 4_/ 532,9 734,7 876,9 969,8 1.130,1 1.078,6 391,6 249,1 153,4 188,2 123,4Mercado Externo 5_/ 391,5 446,0 491,5 489,6 603,4 627,0 525,1 482,4 356,4 437,0 166,9TRANSFERENCIAS CORRIENTES 125,0 178,7 217,6 276,2 332,3 399,4 485,5 301,4 372,3 450,7 435,1OTROS INGRESOS CORRIENTES 454,6 509,1 602,9 780,2 1.017,8 1.114,4 1.285,0 1.712,6 1.633,9 2.127,4 1.623,9Ventas <strong>de</strong> Empresas <strong>de</strong> Corporaciones 230,9 279,6 349,7 393,3 436,3 454,4 341,8 250,4 257,8 173,2 0,0Recuperación <strong>de</strong> Préstamos 0,0 0,0 0,0 58,7 119,5 133,0 279,0 120,6 113,6 40,8 50,1Otros Ingresos 6_/ 223,7 229,5 253,2 328,1 462,0 527,0 664,1 1.341,7 1.262,6 1.913,4 1.573,8INGRESOS DE CAPITAL 314,3 408,0 667,4 418,2 749,3 774,7 1.023,1 1.009,0 970,5 1.273,1 1.455,3Donaciones 283,8 325,6 590,8 377,8 681,3 532,6 897,3 595,1 657,4 884,1 1.157,4Otros Ingresos <strong>de</strong> capital 30,6 82,4 76,5 40,4 68,0 242,1 125,8 413,9 313,1 389,0 297,9EGRESOS TOTALES 5.427,2 7.009,2 8.260,4 9.104,5 10.074,1 11.027,7 12.145,3 14.049,4 16.832,2 17.375,9 19.434,6EGRESOS CORRIENTES 4.150,8 5.349,3 6.053,6 6.858,9 7.595,6 8.381,1 9.084,7 11.031,6 13.548,2 13.937,7 15.757,7SERVICIOS PERSONALES 1.578,7 1.958,5 2.481,5 2.928,0 3.353,2 3.567,3 3.999,5 4.478,3 5.006,7 4.992,0 5.078,6In<strong>de</strong>mnizaciones 63,0 87,4 116,2 205,2 354,4 116,4 253,9 260,2 353,0 176,8 201,4Beneméritos 105,0 110,9 135,7 153,7 171,5 194,7 209,4 226,7 225,8 222,1 220,1Resto <strong>de</strong> Remuneraciones 1.410,7 1.760,2 2.229,6 2.569,0 2.827,4 3.256,2 3.536,1 3.991,4 4.427,9 4.593,2 4.657,1BIENES Y SERVICIOS 1.366,0 1.716,2 1.760,9 1.820,0 1.880,9 2.189,2 2.114,2 2.900,1 4.048,5 4.300,8 5.554,3Contratistas 152,1 211,3 167,2 91,3 123,9 113,5 123,7 210,4 319,4 169,1 564,2Otros 1.213,9 1.504,9 1.593,7 1.728,7 1.757,0 2.075,7 1.990,4 2.689,7 3.729,2 4.131,8 4.990,2OPERACIONES DE MAYOREO 0,0 0,0 0,0 0,0 0,0 0,0 0,0 0,0 0,0 0,0 0,0INTERESES DEUDA EXTERNA 462,1 568,9 536,5 559,8 614,2 774,0 655,8 606,1 570,4 555,9 648,6INTERESES DEUDA INTERNA 99,7 145,6 158,3 130,5 54,8 87,3 179,1 55,4 93,4 205,0 290,1Pérdidas BCB 96,1 131,3 33,5 (87,8) (187,4) (266,4) (237,7) (285,5) (320,9) (199,1) (243,1)Otros 3,6 14,3 124,8 218,3 242,2 353,7 416,8 340,9 414,3 404,1 533,2TRANSFERENCIAS CORRIENTES 393,0 418,0 483,3 565,2 871,0 996,1 1.294,1 2.049,5 2.844,8 2.603,4 2.944,4Emisión <strong>de</strong> Certificados Fiscales a Privados 0,0 71,2 75,9 87,5 294,2 289,4 282,5 525,6 915,9 559,4 554,5Rentistas 7_/ 106,8 204,1 267,2 342,6 406,3 423,9 792,2 1.344,8 1.686,3 1.799,3 2.140,9Otras Transferencias al Secto Privado 286,2 142,7 140,2 135,1 170,6 282,7 219,4 179,2 242,6 244,7 249,0OTROS EGRESOS CORRIENTES 345,1 435,6 677,6 826,2 796,6 831,9 890,9 947,4 956,3 1.202,0 1.205,1Universida<strong>de</strong>s 8_/ 0,0 0,0 0,0 313,6 359,6 399,7 475,0 563,5 572,8 748,7 818,3Crédito <strong>de</strong> Ajuste Estructural (SAC) 0,0 0,0 0,0 109,1 16,0 9,2 24,2 12,3 18,4 0,0 0,0Concesión <strong>de</strong> Préstamos 0,0 0,0 0,0 72,1 131,0 115,2 209,6 20,0 23,1 10,6 7,2Dirección <strong>de</strong> Financiamiento Externo y Monetización 0,0 0,0 0,0 102,8 55,8 33,0 3,5 17,8 2,7 0,1 0,0Otros 345,1 435,6 677,6 228,7 234,2 274,8 178,6 333,7 339,3 442,7 379,6GASTOS NO IDENTIFICADOS (93,9) 106,4 (44,5) 29,3 24,9 (64,7) (48,8) (5,1) 28,1 78,5 36,6EGRESOS DE CAPITAL 9_/ 1.276,5 1.659,9 2.206,9 2.245,6 2.478,5 2.646,5 3.060,5 3.017,7 3.284,0 3.438,2 3.676,9SUPERAVIT (DEFICIT) CORRIENTE 287,6 439,7 576,8 343,4 903,8 1.289,0 1.320,9 644,3 135,2 492,6 285,6SUPERAVIT (DEFICIT) GLOBAL (674,6) (812,2) (962,7) (1.484,0) (825,4) (582,8) (716,5) (1.364,4) (2.178,3) (1.672,5) (1.936,0)FINANCIAMIENTO 674,6 812,2 962,7 1.484,0 825,4 582,8 716,5 1.364,4 2.178,3 1.672,5 1.936,0CREDITO EXTERNO NETO 378,1 621,9 845,6 1.235,2 1.013,6 1.161,2 941,4 1.140,8 1.278,3 923,8 1.018,8Desembolsos 561,6 646,2 920,4 957,0 1.332,4 1.609,8 1.580,5 1.683,5 1.718,9 1.510,9 1.708,9Pago Especial Argentina/Líneas <strong>de</strong> Desarrollo 10_/ 0,0 0,0 0,0 365,8 97,7 0,0 0,0 0,0 0,0 0,0 0,0Amortizaciones (193,3) (210,1) (268,0) (366,2) (498,5) (560,2) (620,2) (524,5) (433,2) (645,2) (756,1)Intereses no pagados 256,6 270,2 248,6 210,0 128,3 194,5 1,0 0,0 0,0 0,0 0,0Pago Mora (9,2) (4,3) (4,7) (5,3) 0,0 0,0 0,0 0,0 0,0 0,0 0,0Atrasos Argentina (59,5) (12,6) 30,1 121,6 0,0 0,0 0,0 0,0 0,0 0,0 0,0Deuda Brasil Suiza/Alivio Deuda Externa HIPC 11_/ (178,1) (56,6) (65,0) (41,3) (50,7) (41,2) 0,0 0,0 14,1 92,1 99,3Otros (Depósitos ENTEL)/Aporte Accionario 0,0 (10,9) (15,8) (6,4) 4,3 (41,7) (19,9) (18,2) (21,6) (34,0) (33,3)CREDITO INTERNO NETO 296,5 190,4 117,1 248,9 (188,2) (578,4) (224,9) 223,7 900,0 748,7 917,2BANCO CENTRAL 324,6 193,3 58,7 218,1 (240,7) (1.094,1) (727,3) (403,1) (280,1) (677,7) 205,3Cuasifiscal 96,1 131,3 33,5 (87,8) (187,4) (266,4) (237,7) (285,5) (320,9) (199,1) (243,1)Resto 228,5 62,0 25,2 305,9 (53,3) (827,8) (489,5) (117,6) 40,8 (478,6) 448,4CONTRATISTAS (15,2) (52,1) (26,4) (3,8) (0,7) (4,0) 0,0 0,0 0,0 0,0 0,0DEUDA FLOTANTE 14,7 91,8 (11,5) 104,9 (244,3) (51,7) (20,6) (37,5) 510,0 91,3 (252,4)OTROS (27,6) (42,7) 96,3 (70,3) 297,6 571,5 522,9 664,3 670,2 1.335,0 964,3Certificados Fiscales (28,5) (41,8) 16,6 (8,9) 3,3 (12,3) 35,8 155,3 159,1 (107,9) (2,1)Depósitos no Corrientes 2,8 (3,0) (4,1) (65,9) (155,4) 55,9 (28,0) (37,1) 18,6 267,3 17,0Letras <strong>de</strong>l Tesoro, Mutuales y Bonos <strong>de</strong>l Tesoro 0,0 0,0 0,0 0,0 454,5 651,8 260,9 127,2 (202,1) 292,5 204,2Bonos AFP (Administradora <strong>de</strong> Fondos <strong>de</strong> Pensiones) 0,0 0,0 0,0 0,0 0,0 0,0 0,0 0,0 791,4 905,2 887,8Otros (2,0) 2,1 83,8 4,4 (4,8) (123,8) 254,2 419,0 (96,8) (22,0) (142,5)Fuente: <strong>Ministerio</strong> <strong>de</strong> <strong>Economía</strong> y <strong>Finanzas</strong> <strong>Públicas</strong>.Elaboración: MEFP-VTCP-Dirección General <strong>de</strong> Análisis y Políticas Fiscales.1_/ Des<strong>de</strong> Junio <strong>de</strong> 2005 se recauda el IDH según la Nueva Ley <strong>de</strong> Hidrocarburos: 3058 <strong>de</strong>l 17 <strong>de</strong> Mayo <strong>de</strong> 2005.2_/ Des<strong>de</strong> Mayo <strong>de</strong> 2006, YPFB realiza operaciones <strong>de</strong> mayorista.3_/ Des<strong>de</strong> 2005 no se registran venta mercado externo y contratistas por tratarse <strong>de</strong> operaciones <strong>de</strong> empresas capitalizadas. Des<strong>de</strong> 2007 se incluye la facturación <strong>de</strong> la venta <strong>de</strong> gas y petróleo <strong>de</strong> YPFB.4_/ En Mayo <strong>de</strong> 2007 por el D.S. 29117 se <strong>de</strong>terminó que COMIBOL explote la reserva fiscal, que actualmente incluye las operaciones mineras en Huanuni.5_/ Mediante D.S. 29026 en Febrero 2007 se nacionalizó la Empresa Metalúrgica Vinto, asumiendo nuevamente operaciones como entidad estatal <strong>de</strong>s<strong>de</strong> su transferencia al sector privado en 1999.6_/ En 1997 se incluye Bs 397 millones <strong>de</strong> por concepto <strong>de</strong> "Aportes Privados".7_/ La reforma <strong>de</strong>l sistema <strong>de</strong> pensiones en 1997 (Ley 1732 <strong>de</strong> 29 <strong>de</strong> Noviembre <strong>de</strong> 1996) establece el Seguro Social Obligatorio (SSO), sistema <strong>de</strong> capitalización individual y <strong>de</strong> administración privada.Las pensiones calificadas como los aportes al anterior sistema son reconocidos por el Estado (Tesoro General <strong>de</strong> la Nación).8_/ Des<strong>de</strong> 2003 el gasto <strong>de</strong> Universida<strong>de</strong>s se registra por partidas.9_/ Líneas <strong>de</strong> Desarrollo: el 2004 se realiza la <strong>de</strong>volución por parte <strong>de</strong>l BCB <strong>de</strong> la línea <strong>de</strong> crédito IDA 1925-BO <strong>de</strong>l Banco Mundial al Tesoro General <strong>de</strong> la Nación.10_/ Des<strong>de</strong> 1998 se registra el Alivio HIPC bajo la modalidad: Donación, Reprogramación y Stock, y en el 2006 bajo la modalidad: Donación y Stock.