Mapas de pobreza y desigualdad de Guatemala
Mapas de pobreza y desigualdad de Guatemala
Mapas de pobreza y desigualdad de Guatemala

You also want an ePaper? Increase the reach of your titles
YUMPU automatically turns print PDFs into web optimized ePapers that Google loves.
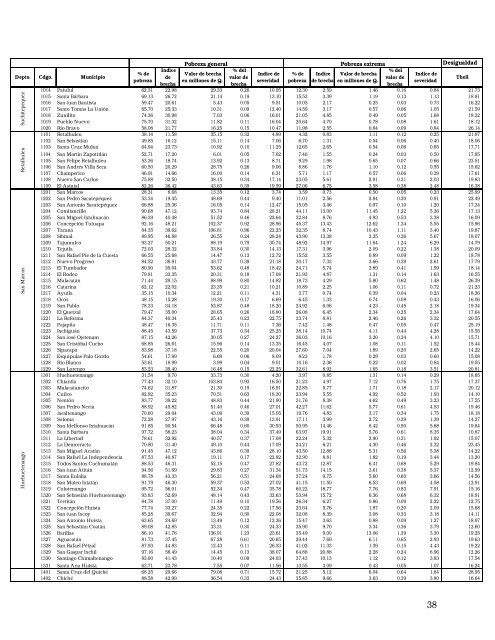
Depto. Cdgo. MunicipioSuchitepequezRetalhuleuSan MarcosHuehuetenango% <strong>de</strong><strong>pobreza</strong>Indice<strong>de</strong>Pobreza generalValor <strong>de</strong> brechaen millones <strong>de</strong> Q.% <strong>de</strong>lvalor <strong>de</strong>Indice <strong>de</strong>severidadPobreza extremaDesigualdadbrechabrechabrecha1014 Patulul 62.31 22.98 29.33 0.26 10.95 12.30 2.59 1.46 0.16 0.84 21.731015 Santa Bárbara 69.13 26.72 21.14 0.19 13.10 15.53 3.39 1.19 0.13 1.13 18.811016 San Juan Bautista 59.47 20.61 5.43 0.05 9.51 10.05 2.17 0.25 0.03 0.73 16.221017 Santo Tomás La Unión 65.70 25.33 10.31 0.09 12.40 14.59 3.17 0.57 0.06 1.05 21.591018 Zunilito 74.36 30.98 7.03 0.06 16.01 21.05 4.85 0.49 0.05 1.68 18.321019 Pueblo Nuevo 75.70 31.32 11.82 0.11 16.04 20.64 4.70 0.78 0.08 1.61 18.121020 Río Bravo 58.08 21.77 16.25 0.15 10.47 11.98 2.55 0.84 0.09 0.84 26.141101 Retalhuleu 38.14 11.58 35.15 0.32 4.89 4.32 0.83 1.11 0.12 0.25 21.971102 San Sebastián 49.85 16.12 15.11 0.14 7.06 6.70 1.31 0.54 0.06 0.40 18.061103 Santa Cruz Muluá 64.94 23.73 10.92 0.10 11.25 12.65 2.65 0.54 0.06 0.85 17.711104 San Martín Zapotitlán 52.71 17.20 6.01 0.05 7.62 7.46 1.55 0.24 0.03 0.50 17.851105 San Felipe Retalhuleu 53.36 18.74 13.92 0.13 8.71 9.29 1.98 0.65 0.07 0.66 23.511106 San Andrés Villa Seca 60.50 20.29 28.75 0.26 9.06 8.86 1.76 1.10 0.12 0.55 15.621107 Champerico 46.91 14.66 16.00 0.14 6.31 5.71 1.17 0.57 0.06 0.39 17.611108 Nuevo San Carlos 75.88 32.50 38.15 0.34 17.14 23.05 5.61 2.91 0.31 2.03 19.831109 El Asintal 82.26 36.42 43.63 0.39 19.59 27.06 6.75 3.58 0.38 2.48 16.381201 San Marcos 28.31 8.68 13.35 0.12 3.74 3.59 0.73 0.50 0.05 0.23 25.991202 San Pedro Sacatepéquez 53.34 19.45 48.69 0.44 9.40 11.01 2.56 2.84 0.30 0.91 22.491203 San Antonio Sacatepéquez 66.88 25.36 16.05 0.14 12.47 15.05 3.46 0.97 0.10 1.20 17.341204 Comitancillo 90.68 47.12 93.74 0.84 28.21 44.11 13.00 11.45 1.22 5.36 17.131205 San Miguel Ixtahuacán 86.39 40.48 51.52 0.46 22.64 32.84 8.76 4.93 0.53 3.38 16.091206 Concepción Tutuapa 92.16 48.21 102.37 0.92 28.96 45.37 13.43 12.62 1.34 5.55 15.961207 Tacaná 84.35 39.62 106.81 0.96 22.25 32.35 8.74 10.43 1.11 3.40 19.871208 Sibinal 89.95 46.88 26.55 0.24 28.24 43.90 13.38 3.35 0.36 5.67 18.071209 Tajumulco 93.27 50.21 88.19 0.79 30.74 48.92 14.97 11.64 1.24 6.29 14.791210 Tejutla 72.03 28.32 33.84 0.30 14.13 17.31 3.96 2.09 0.22 1.38 20.091211 San Rafael Pie <strong>de</strong> la Cuesta 66.55 25.68 14.47 0.13 12.72 15.52 3.55 0.89 0.09 1.22 18.781212 Nuevo Progreso 84.52 38.81 43.77 0.39 21.18 30.17 7.33 3.66 0.39 2.61 17.791213 El Tumbador 80.90 35.04 53.62 0.48 18.42 24.71 5.74 3.89 0.41 1.99 18.141214 El Ro<strong>de</strong>o 79.81 33.35 20.31 0.18 17.08 21.93 4.87 1.31 0.14 1.63 16.551215 Malacatán 71.44 29.15 88.99 0.80 14.82 18.73 4.29 5.80 0.62 1.48 26.391216 Catarina 62.12 22.02 23.35 0.21 10.21 10.89 2.25 1.06 0.11 0.72 21.231217 Ayutla 35.15 10.34 12.21 0.11 4.31 3.77 0.74 0.39 0.04 0.23 18.361218 Ocós 48.15 15.28 19.30 0.17 6.69 6.45 1.33 0.74 0.08 0.43 16.061219 San Pablo 78.33 34.18 53.87 0.48 18.20 24.92 6.06 4.23 0.45 2.18 19.341220 El Quetzal 79.47 35.00 28.65 0.26 18.80 26.08 6.45 2.34 0.25 2.34 17.641221 La Reforma 84.37 40.34 25.43 0.23 22.75 33.74 8.81 2.46 0.26 3.32 20.551222 Pajapita 48.47 16.35 11.71 0.11 7.36 7.42 1.48 0.47 0.05 0.47 25.191223 Ixchiguán 88.45 43.59 37.73 0.34 25.25 38.14 10.74 4.11 0.44 4.28 15.551224 San José Ojetenam 87.15 42.26 30.05 0.27 24.27 36.03 10.16 3.20 0.34 4.10 15.711225 San Cristóbal Cucho 68.85 26.61 15.96 0.14 13.35 16.45 4.07 1.08 0.11 1.52 15.441226 Sipacapa 83.98 37.18 22.55 0.20 20.04 27.60 7.04 1.89 0.20 2.65 14.221227 Esquipulas Palo Gordo 54.61 17.99 6.69 0.06 8.09 8.23 1.78 0.29 0.03 0.60 15.081228 Río Blanco 53.61 18.99 3.99 0.04 9.01 10.16 2.36 0.22 0.02 0.84 19.551229 San Lorenzo 83.53 39.40 16.48 0.15 22.25 32.61 8.92 1.65 0.18 3.51 20.811301 Huehuetenango 31.54 9.70 33.73 0.30 4.20 3.97 0.85 1.31 0.14 0.29 18.851302 Chiantla 77.43 32.10 103.84 0.93 16.50 21.23 4.97 7.12 0.76 1.75 17.371303 Malacatancito 74.62 31.87 21.30 0.19 16.91 22.85 5.77 1.71 0.18 2.17 20.121304 Cuilco 82.82 35.23 70.51 0.63 18.30 23.94 5.55 4.92 0.52 1.93 14.101305 Nentón 83.77 39.22 48.83 0.44 21.90 31.76 8.38 4.62 0.49 3.23 17.551306 San Pedro Necta 88.92 45.82 51.40 0.46 27.01 42.27 11.62 5.77 0.61 4.53 19.461307 Jacaltenango 70.60 29.04 43.09 0.39 15.05 19.76 4.83 3.17 0.34 1.75 18.181308 Soloma 72.28 27.97 43.16 0.39 13.91 17.11 3.99 2.72 0.29 1.39 14.271309 San I<strong>de</strong>lfonso Ixtahuacán 91.85 50.54 66.48 0.60 30.93 50.95 14.46 8.42 0.90 5.68 19.841310 Santa Bárbara 97.72 58.23 38.04 0.34 37.49 63.97 19.91 5.76 0.61 8.35 10.871311 La Libertad 78.61 32.92 40.57 0.37 17.08 22.24 5.32 2.90 0.31 1.92 15.071312 La Democracia 70.80 31.40 49.10 0.44 17.09 24.21 6.21 4.30 0.46 2.32 23.451313 San Miguel Acatán 91.45 47.12 43.86 0.39 28.10 43.50 12.88 5.31 0.56 5.38 14.221314 San Rafael La In<strong>de</strong>pen<strong>de</strong>ncia 87.53 40.87 19.11 0.17 22.82 32.90 8.81 1.82 0.19 3.44 13.201315 Todos Santos Cuchumatán 88.53 46.31 52.15 0.47 27.82 43.72 12.87 6.41 0.68 5.29 19.841316 San Juan Atitán 94.56 51.69 29.83 0.27 31.34 51.73 14.15 3.61 0.38 5.37 12.991317 Santa Eulalia 88.78 43.33 56.21 0.51 24.68 37.24 9.75 5.60 0.60 3.66 14.561318 San Mateo Ixtatán 91.79 46.30 59.37 0.53 27.02 41.15 11.50 6.53 0.69 4.58 12.911319 Colotenango 95.72 56.01 52.34 0.47 35.78 60.22 18.77 7.76 0.83 7.91 15.161320 San Sebastián Huehuetenango 93.83 52.69 48.14 0.43 32.63 53.94 15.72 6.36 0.68 6.32 18.911321 Tectitán 84.78 37.00 11.49 0.10 19.56 26.34 6.27 0.86 0.09 2.22 12.751322 Concepción Huista 77.74 33.27 24.35 0.22 17.56 23.64 5.76 1.87 0.20 2.09 15.681323 San Juan Ixcoy 85.28 39.67 32.94 0.30 22.08 32.08 8.39 3.08 0.33 3.18 14.111324 San Antonio Huista 63.65 24.69 13.49 0.12 12.36 15.47 3.63 0.88 0.09 1.27 18.971325 San Sebastián Coatán 89.08 42.85 33.31 0.30 24.33 35.90 9.70 3.34 0.36 3.79 12.601326 Barillas 86.10 41.76 136.91 1.23 23.61 35.49 9.00 13.06 1.39 3.30 19.251327 Aguacatán 81.73 37.45 67.28 0.61 20.65 29.44 7.69 6.11 0.65 2.93 19.631328 San Rafael Pétzal 87.93 44.83 12.43 0.11 26.33 41.02 11.33 1.39 0.15 4.43 19.221329 San Gaspar Ixchil 97.16 58.49 14.45 0.13 38.07 64.88 20.88 2.28 0.24 8.96 12.261330 Santiago Chimaltenango 83.90 41.43 10.40 0.09 24.03 37.43 10.13 1.12 0.12 3.83 17.541331 Santa Ana Huista 63.71 23.78 7.55 0.07 11.56 13.55 3.09 0.43 0.05 1.07 16.241401 Santa Cruz <strong>de</strong>l Quiché 68.25 29.66 79.08 0.71 15.72 21.25 5.12 6.04 0.64 1.84 28.951402 Chiché 88.58 42.99 36.54 0.33 24.43 35.85 9.66 3.63 0.39 3.80 16.64% <strong>de</strong><strong>pobreza</strong>Indice<strong>de</strong> brechaValor <strong>de</strong> brechaen millones <strong>de</strong> Q.% <strong>de</strong>lvalor <strong>de</strong>Indice <strong>de</strong>severidadTheil38