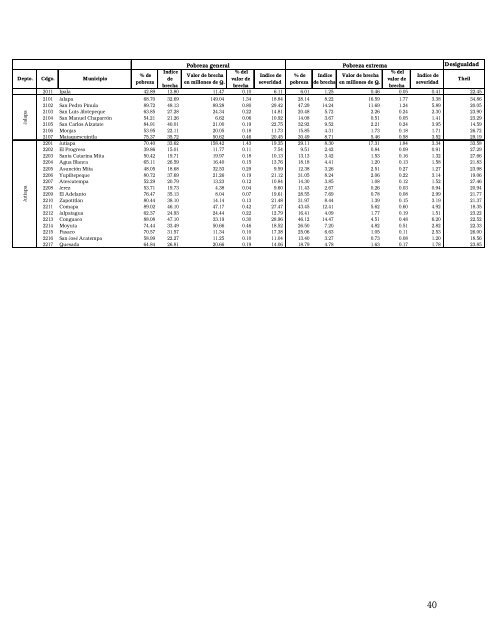
Depto. Cdgo. MunicipioJalapaJutiapa% <strong>de</strong><strong>pobreza</strong>Indice<strong>de</strong>Pobreza generalValor <strong>de</strong> brechaen millones <strong>de</strong> Q.% <strong>de</strong>lvalor <strong>de</strong>Indice <strong>de</strong>severidadPobreza extremaIndice <strong>de</strong>severidadDesigualdadbrechabrechabrecha2011 Ipala 42.89 13.80 11.47 0.10 6.11 6.01 1.25 0.46 0.05 0.41 22.452101 Jalapa 68.70 32.69 149.04 1.34 18.84 28.14 8.22 16.59 1.77 3.38 34.862102 San Pedro Pinula 89.72 48.13 89.28 0.80 29.42 47.29 14.24 11.69 1.24 5.89 20.052103 San Luis Jilotepeque 63.85 27.28 24.34 0.22 14.81 20.48 5.72 2.26 0.24 2.30 23.902104 San Manuel Chaparrón 54.21 21.26 6.62 0.06 10.92 14.08 3.67 0.51 0.05 1.41 23.292105 San Carlos Alzatate 84.91 40.01 21.00 0.19 22.75 32.92 9.52 2.21 0.24 3.95 14.592106 Monjas 53.95 22.11 20.05 0.18 11.73 15.85 4.31 1.73 0.18 1.71 26.722107 Mataquescuintla 75.37 35.72 50.62 0.46 20.45 30.49 8.71 5.46 0.58 3.52 29.192201 Jutiapa 70.40 33.62 158.42 1.43 19.35 29.11 8.30 17.31 1.84 3.34 33.582202 El Progreso 39.86 15.01 11.77 0.11 7.54 9.51 2.42 0.84 0.09 0.91 27.292203 Santa Catarina Mita 50.42 19.71 19.97 0.18 10.13 13.13 3.42 1.53 0.16 1.32 27.662204 Agua Blanca 65.11 26.59 16.40 0.15 13.76 18.18 4.41 1.20 0.13 1.58 21.832205 Asunción Mita 48.05 18.68 32.53 0.29 9.59 12.38 3.26 2.51 0.27 1.27 23.982206 Yupiltepeque 80.72 37.69 21.26 0.19 21.12 31.05 8.24 2.06 0.22 3.14 19.062207 Atescatempa 52.29 20.79 13.23 0.12 10.84 14.30 3.85 1.08 0.12 1.52 27.462208 Jerez 53.71 19.73 4.38 0.04 9.60 11.43 2.67 0.26 0.03 0.94 20.942209 El A<strong>de</strong>lanto 76.47 35.13 8.04 0.07 19.61 28.55 7.69 0.78 0.08 2.99 21.772210 Zapotitlán 80.44 38.10 14.14 0.13 21.48 31.97 8.44 1.39 0.15 3.19 21.372211 Comapa 89.02 46.10 47.17 0.42 27.47 43.45 12.41 5.62 0.60 4.92 18.352212 Jalpatagua 62.37 24.93 24.44 0.22 12.79 16.41 4.09 1.77 0.19 1.51 23.222213 Conguaco 88.08 47.10 33.19 0.30 28.96 46.12 14.47 4.51 0.48 6.20 22.522214 Moyuta 74.44 33.49 50.66 0.46 18.52 26.50 7.20 4.82 0.51 2.82 22.332215 Pasaco 70.57 31.57 11.34 0.10 17.38 25.06 6.63 1.05 0.11 2.53 26.002216 San José Acatempa 58.99 22.27 11.25 0.10 11.04 13.40 3.27 0.73 0.08 1.20 18.562217 Quesada 64.84 26.81 20.66 0.19 14.06 18.79 4.78 1.63 0.17 1.78 23.85% <strong>de</strong><strong>pobreza</strong>Indice<strong>de</strong> brechaValor <strong>de</strong> brechaen millones <strong>de</strong> Q.% <strong>de</strong>lvalor <strong>de</strong>Theil40
Nota técnica 1Resumen <strong>de</strong> la metodología empleada en la elaboración <strong>de</strong> los <strong>Mapas</strong> <strong>de</strong> Pobreza 9Un mapa <strong>de</strong> <strong>pobreza</strong> es una representación gráfica, que <strong>de</strong>ja en manifiesto los lugares yregiones <strong>de</strong> un país en don<strong>de</strong> se concentra el fenómeno <strong>de</strong> la <strong>pobreza</strong> y la <strong>de</strong>sigualdad.Para la medición <strong>de</strong> la <strong>pobreza</strong> es necesario <strong>de</strong>finir una medida <strong>de</strong> bienestar, un umbralque permita la comparación y clasificación <strong>de</strong>l bienestar <strong>de</strong> los individuos y hogares, yun indicador <strong>de</strong> <strong>pobreza</strong>.El Mapa <strong>de</strong> Pobreza presentado en este documento, consi<strong>de</strong>ra que un hogar seencuentra en situación <strong>de</strong> <strong>pobreza</strong> o <strong>pobreza</strong> extrema cuando su consumo per cápita seencuentra por <strong>de</strong>bajo <strong>de</strong> un mínimo establecido por las líneas <strong>de</strong> <strong>pobreza</strong>. La línea <strong>de</strong><strong>pobreza</strong> general se sitúa en Q.4,318 y la línea <strong>de</strong> <strong>pobreza</strong> extrema en Q.1,911 10 .Tradicionalmente, los países tienen dos importantes fuentes <strong>de</strong> información para elanálisis <strong>de</strong> las condiciones <strong>de</strong> vida <strong>de</strong> la población. Por un lado, las encuestas <strong>de</strong>hogares que proporcionan información como el consumo, lo que permite laconstrucción <strong>de</strong> una medida a<strong>de</strong>cuada <strong>de</strong> bienestar. Por otro, los censos <strong>de</strong> poblaciónque, aunque no recoge muchas variables, da la oportunidad <strong>de</strong> conocer características<strong>de</strong> las personas y hogares con una <strong>de</strong>sagregación geográfica importante.La metodología usada para la construcción <strong>de</strong> este mapa probabilístico, <strong>de</strong>sarrolladapor Hentschel et.al. <strong>de</strong>l Banco Mundial, combina la amplia información censal con laprofundidad <strong>de</strong> las encuestas <strong>de</strong> hogares. En este caso se conjugó la Encuesta <strong>de</strong>Condiciones <strong>de</strong> Vida <strong>de</strong>l año 2000 con el Censo <strong>de</strong> Población y Vivienda <strong>de</strong>l año 2002,a<strong>de</strong>más <strong>de</strong> una serie <strong>de</strong> variables externas 11 .El método consiste en estimar mo<strong>de</strong>los <strong>de</strong> consumo en función <strong>de</strong> variables incluidas enla encuesta que también existan <strong>de</strong>ntro <strong>de</strong> la información censal. Es <strong>de</strong>cir, <strong>de</strong> la encuesta<strong>de</strong> hogares se obtiene la relación que pueda existir entre las características <strong>de</strong>l hogar ysu consumo observado para luego aplicar los parámetros <strong>de</strong>terminados a lainformación censal, y así obtener un pronóstico <strong>de</strong>l consumo <strong>de</strong> los hogares <strong>de</strong>l país.Cabe mencionar que los mo<strong>de</strong>los no preten<strong>de</strong>n ser explicativos y reflejan lascondiciones <strong>de</strong> vida existentes en el año censal (2002).Esta metodología ha permitido a varios países (Argentina, Ecuador, Madagascar,México, Nicaragua, Panamá, Senegal, entre otros) estimar las tasas <strong>de</strong> <strong>pobreza</strong> a nivelesgeográficos pequeños. En el caso <strong>de</strong>l presente mapa, los indicadores fueron elaborados9 Para mayor <strong>de</strong>talle ver Hentschel,; Lanjouw y J. Poggi. (1998)10 Calculadas con información <strong>de</strong> ENCOVI 2000 por INE, SEGEPLAN y URL, con la asistencia <strong>de</strong>l BancoMundial.11 24 variables externas <strong>de</strong> diversas fuentes.41