Indicadores <strong>de</strong> Comercio Exterior • <strong>Cuarto</strong> Trimestre <strong>de</strong> 2006GRÁFICO 1 PARTICIPACIÓN DE LOS PRINCIPALES SUBSECTORES AGROPECUARIOS DE EXPORTACIÓN, 2006(Porcentaje)Agrícola86,5Pecuario13,5Fuente: Elaborado a base <strong>de</strong> información <strong>de</strong>l cuadro 1.Productos agrícolasDentro <strong>de</strong> las exportaciones agrícolas <strong>de</strong>stacaron los rubrosfruta y vino, que en el año 2006 aportaron 61,5% y 19,5%respectivamente, a esta agrupación. Los ítems hortaliza ysemilla tuvieron participaciones cercanas a 4%, como muestrael gráfico 2.GRÁFICO 2 PARTICIPACIÓN DE LOS PRINCIPALES RUBROS DE EXPORTACIÓN DEL SECTOR AGRÍCOLA, 2006(Porcentaje)Vino19,5Fruta61,5Hortaliza3,9Semilla3,6Los <strong>de</strong>más11,5Fuente: Elaborado a base <strong>de</strong> información <strong>de</strong>l cuadro 1.Los principales <strong>de</strong>stinos <strong>de</strong> la exportación agrícola, en 2006,fueron Estados Unidos, la Unión Europea y la Aladi, conparticipaciones <strong>de</strong> 34%, 28% y 19%, respectivamente. Entrelas regiones más relevantes, la que mostró mayor dinamismofue la Aladi, con 17,5% <strong>de</strong> crecimiento anual en 2006; la UniónEuropea con 10,9% <strong>de</strong> aumento y Estados Unidos con uncrecimiento <strong>de</strong> 10,7%, ambos, por <strong>de</strong>bajo <strong>de</strong>l <strong>de</strong>sempeñopromedio <strong>de</strong>l sector agrícola (12,5%), como se observa en elcuadro 2.15
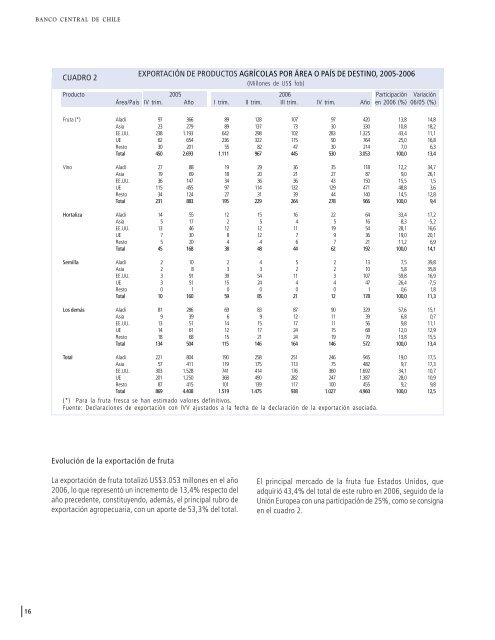
BANCO CENTRAL DE CHILECUADRO 2EXPORTACIÓN DE PRODUCTOS AGRÍCOLAS POR ÁREA O PAÍS DE DESTINO, 2005-2006(Millones <strong>de</strong> US$ fob)Producto 2005 2006 Participación VariaciónÁrea/País IV trim. Año I trim. II trim. III trim. IV trim. Año en 2006 (%) 06/05 (%)Fruta (*) Aladi 97 366 89 128 107 97 420 13,8 14,8Asia 23 279 89 137 73 30 330 10,8 18,2EE.UU. 238 1.193 642 298 102 283 1.325 43,4 11,1UE 62 654 236 322 115 90 764 25,0 16,8Resto 30 201 55 82 47 30 214 7,0 6,3Total 450 2.693 1.111 967 445 530 3.053 100,0 13,4Vino Aladi 27 88 19 29 36 35 118 12,2 34,7Asia 19 69 18 20 21 27 87 9,0 26,1EE.UU. 36 147 34 36 36 43 150 15,5 1,5UE 115 455 97 114 132 129 471 48,8 3,6Resto 34 124 27 31 39 44 140 14,5 12,8Total 231 883 195 229 264 278 966 100,0 9,4Hortaliza Aladi 14 55 12 15 16 22 64 33,4 17,2Asia 5 17 2 5 4 5 16 8,3 -5,2EE.UU. 13 46 12 12 11 19 54 28,1 16,6UE 7 30 8 12 7 9 36 19,0 20,1Resto 5 20 4 4 6 7 21 11,2 6,9Total 45 168 38 48 44 62 192 100,0 14,1Semilla Aladi 2 10 2 4 5 2 13 7,5 39,8Asia 2 8 3 3 2 2 10 5,8 35,8EE.UU. 3 91 39 54 11 3 107 59,8 16,9UE 3 51 15 24 4 4 47 26,4 -7,5Resto 0 1 0 0 0 0 1 0,6 1,8Total 10 160 59 85 21 12 178 100,0 11,3Los <strong>de</strong>más Aladi 81 286 69 83 87 90 329 57,6 15,1Asia 9 39 6 9 12 11 39 6,8 0,7EE.UU. 13 51 14 15 17 11 56 9,8 11,1UE 14 61 12 17 24 15 68 12,0 12,9Resto 18 68 15 21 24 19 79 13,8 15,5Total 134 504 115 146 164 146 572 100,0 13,4Total Aladi 221 804 190 258 251 246 945 19,0 17,5Asia 57 411 119 175 113 75 482 9,7 17,3EE.UU. 303 1.528 741 414 176 360 1.692 34,1 10,7UE 201 1.250 368 490 282 247 1.387 28,0 10,9Resto 87 415 101 139 117 100 455 9,2 9,8Total 869 4.408 1.519 1.475 938 1.027 4.960 100,0 12,5(*) Para la fruta fresca se han estimado valores <strong>de</strong>finitivos.Fuente: Declaraciones <strong>de</strong> exportación con IVV ajustados a la fecha <strong>de</strong> la <strong>de</strong>claración <strong>de</strong> la exportación asociada.Evolución <strong>de</strong> la exportación <strong>de</strong> frutaLa exportación <strong>de</strong> fruta totalizó US$3.053 millones en el año2006, lo que representó un incremento <strong>de</strong> 13,4% respecto <strong>de</strong>laño prece<strong>de</strong>nte, constituyendo, a<strong>de</strong>más, el principal rubro <strong>de</strong>exportación agropecuaria, con un aporte <strong>de</strong> 53,3% <strong>de</strong>l total.El principal mercado <strong>de</strong> la fruta fue Estados Unidos, queadquirió 43,4% <strong>de</strong>l total <strong>de</strong> este rubro en 2006, seguido <strong>de</strong> laUnión Europea con una participación <strong>de</strong> 25%, como se consignaen el cuadro 2.16
- Page 1 and 2: Indicadores deComercio ExteriorCuar
- Page 3 and 4: I. Resumen del Comercio Exterior
- Page 5 and 6: BANCO CENTRAL DE CHILECUADRO 1 COME
- Page 7 and 8: II. Estudio
- Page 9: BANCO CENTRAL DE CHILEImportancia d
- Page 13 and 14: BANCO CENTRAL DE CHILEEvolución de
- Page 15 and 16: BANCO CENTRAL DE CHILEGRÁFICO 3 PA
- Page 17 and 18: BANCO CENTRAL DE CHILELa exportaci
- Page 19 and 20: BANCO CENTRAL DE CHILEANEXO 3EXPORT
- Page 21 and 22: BANCO CENTRAL DE CHILEANEXO 8EXPORT
- Page 23 and 24: Exportaciones
- Page 25 and 26: BANCO CENTRAL DE CHILEEXPORTACIONES
- Page 27 and 28: BANCO CENTRAL DE CHILEEXPORTACIÓN
- Page 29 and 30: BANCO CENTRAL DE CHILEEXPORTACIÓN
- Page 31 and 32: BANCO CENTRAL DE CHILEEXPORTACIÓN
- Page 33 and 34: BANCO CENTRAL DE CHILEEXPORTACIÓN
- Page 35 and 36: BANCO CENTRAL DE CHILEEXPORTACIÓN
- Page 37 and 38: BANCO CENTRAL DE CHILEEXPORTACIÓN
- Page 39 and 40: BANCO CENTRAL DE CHILEEXPORTACIÓN
- Page 41 and 42: BANCO CENTRAL DE CHILEEXPORTACIÓN
- Page 43 and 44: BANCO CENTRAL DE CHILEEXPORTACIÓN
- Page 45 and 46: BANCO CENTRAL DE CHILEEXPORTACIÓN
- Page 47 and 48: BANCO CENTRAL DE CHILEEXPORTACIÓN
- Page 49 and 50: BANCO CENTRAL DE CHILEEXPORTACIÓN
- Page 51 and 52: BANCO CENTRAL DE CHILEEXPORTACIÓN
- Page 53 and 54: BANCO CENTRAL DE CHILE(Continuació
- Page 55 and 56: BANCO CENTRAL DE CHILE(Continuació
- Page 57 and 58: Importaciones
- Page 59 and 60: BANCO CENTRAL DE CHILEIMPORTACIONES
- Page 61 and 62:
BANCO CENTRAL DE CHILEIMPORTACIÓN
- Page 63 and 64:
BANCO CENTRAL DE CHILEIMPORTACIÓN
- Page 65 and 66:
BANCO CENTRAL DE CHILEIMPORTACIÓN
- Page 67 and 68:
BANCO CENTRAL DE CHILEIMPORTACIÓN
- Page 69 and 70:
BANCO CENTRAL DE CHILEIMPORTACIÓN
- Page 71 and 72:
BANCO CENTRAL DE CHILEIMPORTACIÓN
- Page 73 and 74:
BANCO CENTRAL DE CHILEIMPORTACIÓN
- Page 75 and 76:
BANCO CENTRAL DE CHILEIMPORTACIÓN
- Page 77 and 78:
BANCO CENTRAL DE CHILEIMPORTACIÓN
- Page 79 and 80:
BANCO CENTRAL DE CHILEIMPORTACIÓN
- Page 81 and 82:
BANCO CENTRAL DE CHILEIMPORTACIÓN
- Page 83 and 84:
BANCO CENTRAL DE CHILEIMPORTACIÓN
- Page 85 and 86:
BANCO CENTRAL DE CHILEIMPORTACIÓN
- Page 87 and 88:
BANCO CENTRAL DE CHILEIMPORTACIÓN
- Page 89 and 90:
BANCO CENTRAL DE CHILEIMPORTACIÓN
- Page 91 and 92:
BANCO CENTRAL DE CHILEIMPORTACIÓN
- Page 93 and 94:
BANCO CENTRAL DE CHILEIMPORTACIÓN
- Page 95 and 96:
BANCO CENTRAL DE CHILEIMPORTACIÓN
- Page 97 and 98:
BANCO CENTRAL DE CHILEIMPORTACIÓN
- Page 99 and 100:
BANCO CENTRAL DE CHILEIMPORTACIÓN
- Page 101 and 102:
BANCO CENTRAL DE CHILEIMPORTACIÓN
- Page 103 and 104:
BANCO CENTRAL DE CHILEIMPORTACIÓN
- Page 105 and 106:
BANCO CENTRAL DE CHILEIMPORTACIÓN
- Page 107 and 108:
BANCO CENTRAL DE CHILEIMPORTACIÓN
- Page 109 and 110:
BANCO CENTRAL DE CHILEIMPORTACIÓN
- Page 111 and 112:
BANCO CENTRAL DE CHILE(Continuació
- Page 113 and 114:
BANCO CENTRAL DE CHILE(Continuació
- Page 115 and 116:
Indicadores de Comercio Exterior
- Page 117 and 118:
Indicadores de Comercio Exterior
- Page 119 and 120:
Indicadores de Comercio Exterior
- Page 121 and 122:
Indicadores de Comercio Exterior
- Page 123 and 124:
Indicadores de Comercio Exterior
- Page 125 and 126:
Principales Productos Exportadose I
- Page 127 and 128:
Indicadores de Comercio Exterior
- Page 129 and 130:
Indicadores de Comercio Exterior
- Page 131 and 132:
Indicadores de Comercio Exterior
- Page 133 and 134:
Indicadores de Comercio Exterior
- Page 135 and 136:
Indicadores de Comercio Exterior
- Page 137 and 138:
Indicadores de Comercio Exterior
- Page 139 and 140:
Indicadores de Comercio Exterior
- Page 141 and 142:
Indicadores de Comercio Exterior
- Page 143 and 144:
Indicadores de Comercio Exterior
- Page 145 and 146:
Indicadores de Comercio Exterior
- Page 147 and 148:
Indicadores de Comercio Exterior
- Page 149 and 150:
Indicadores de Comercio Exterior
- Page 151 and 152:
Indicadores de Comercio Exterior
- Page 153 and 154:
Indicadores de Comercio Exterior
- Page 155 and 156:
Indicadores de Comercio Exterior
- Page 157 and 158:
Europa
- Page 159 and 160:
BANCO CENTRAL DE CHILEPRINCIPALES P
- Page 161 and 162:
BANCO CENTRAL DE CHILE(Continuació
- Page 163 and 164:
BANCO CENTRAL DE CHILE(Continuació
- Page 165 and 166:
BANCO CENTRAL DE CHILE(Continuació
- Page 167 and 168:
BANCO CENTRAL DE CHILE(Continuació
- Page 169 and 170:
BANCO CENTRAL DE CHILE(Continuació
- Page 171 and 172:
BANCO CENTRAL DE CHILE(Continuació
- Page 173 and 174:
BANCO CENTRAL DE CHILE(Continuació
- Page 175 and 176:
BANCO CENTRAL DE CHILE(Continuació
- Page 177 and 178:
BANCO CENTRAL DE CHILE(Continuació
- Page 179 and 180:
BANCO CENTRAL DE CHILE(Continuació
- Page 181 and 182:
BANCO CENTRAL DE CHILE(Continuació
- Page 183 and 184:
BANCO CENTRAL DE CHILECÓDIGODESCRI
- Page 185 and 186:
BANCO CENTRAL DE CHILE(Continuació
- Page 187 and 188:
BANCO CENTRAL DE CHILE(Continuació
- Page 189 and 190:
BANCO CENTRAL DE CHILEPRINCIPALES P
- Page 191 and 192:
BANCO CENTRAL DE CHILE(Continuació
- Page 193 and 194:
BANCO CENTRAL DE CHILE(Continuació
- Page 195 and 196:
BANCO CENTRAL DE CHILE(Continuació
- Page 197 and 198:
BANCO CENTRAL DE CHILE(Continuació
- Page 199 and 200:
BANCO CENTRAL DE CHILE(Continuació
- Page 201 and 202:
BANCO CENTRAL DE CHILE(Continuació
- Page 203 and 204:
BANCO CENTRAL DE CHILE(Continuació
- Page 205 and 206:
BANCO CENTRAL DE CHILE(Continuació
- Page 207 and 208:
Asia
- Page 209 and 210:
BANCO CENTRAL DE CHILE(Continuació
- Page 211 and 212:
BANCO CENTRAL DE CHILE(Continuació
- Page 213 and 214:
BANCO CENTRAL DE CHILE(Continuació
- Page 215 and 216:
BANCO CENTRAL DE CHILE(Continuació
- Page 217 and 218:
BANCO CENTRAL DE CHILE(Continuació
- Page 219 and 220:
BANCO CENTRAL DE CHILE(Continuació
- Page 221 and 222:
BANCO CENTRAL DE CHILEPRINCIPALES P
- Page 223 and 224:
BANCO CENTRAL DE CHILE(Continuació
- Page 225 and 226:
BANCO CENTRAL DE CHILE(Continuació
- Page 227 and 228:
BANCO CENTRAL DE CHILE(Continuació
- Page 229 and 230:
BANCO CENTRAL DE CHILE(Continuació
- Page 231 and 232:
BANCO CENTRAL DE CHILE(Continuació
- Page 233 and 234:
BANCO CENTRAL DE CHILE(Continuació
- Page 235 and 236:
África
- Page 237 and 238:
BANCO CENTRAL DE CHILE(Continuació
- Page 239 and 240:
BANCO CENTRAL DE CHILE(Continuació
- Page 241 and 242:
Indicadores de Comercio Exterior
- Page 243 and 244:
Indicadores de Comercio Exterior
- Page 245 and 246:
Indicadores de Comercio Exterior
- Page 247 and 248:
Indicadores deComercio ExteriorÍND
- Page 249 and 250:
BANCO CENTRAL DE CHILEMateria Búsq
- Page 251 and 252:
BANCO CENTRAL DE CHILEMateria Búsq
- Page 253 and 254:
Materia Búsquese en PáginaI Trim.
- Page 255:
Publicación editada por el Departa